

Promotion: Capital invested is at risk. Non-Independent Research / Marketing Communication. Attention is drawn to the disclaimers and risk warnings within this document.
BROKER NOTE BY JONATHAN PLANT - September 2026
Evidence-led valuation framework for Kingdom of Saudi Arabia Sustainable Aviation Fuel (KSA SAF), UK optionality, certificate economics and platform repeatability
HUI’s early hydrogen story looked like a barrage balloon: filled with the lightest element in the universe, full of lift, but still tethered to the ground by unclear economics, project funding, revenue capture and shareholder attribution. The current evidence gives that story forward thrust: the KSA SAF model is the engine, UK policy support adds a second runway, certificate pricing provides lift, the fee/carry architecture gives HUI a clearer economic route, and execution partners begin to turn concept into a potentially bankable project-development super-jet.
The market’s scepticism was understandable. HUI had ambitious technology and a strong RNS trail, but the bridge from project potential to shareholder value was not yet clear enough. Earlier analysis therefore applied a cautious lens around fee entitlement, carry protection, project funding, ownership mechanics and value leakage to HUI plc shareholders.
The story is still complex, but now more investable. The KSA SAF model, UK licence, fee-stack expectation, intended immediate carry, certificate-sensitive pricing, IO / downstream / EPC evidence and repeatability potential now point to one test: can HUI convert waste-to-fuels project creation into attributable shareholder economics?
(Clear Capital Markets acts as Broker to Hydrogen Utopia International Plc.)
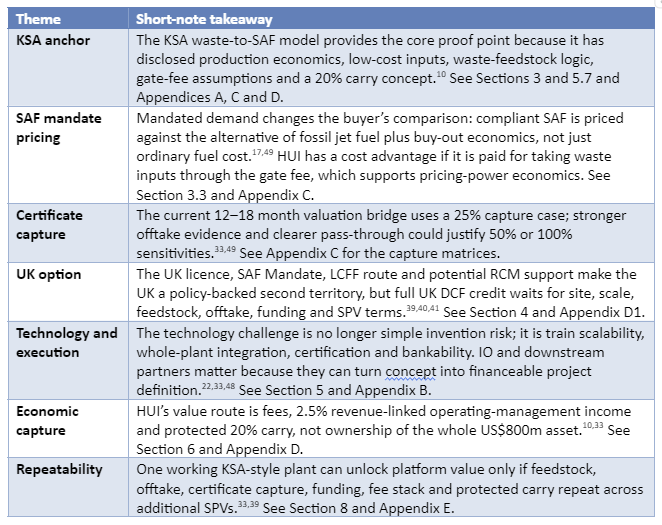
This short extract is designed for readers who want the investment case before working through the full note. The thesis has moved from broad hydrogen optionality to a more investable waste-to-SAF project-origination model. KSA is the economic proof point, the UK is the policy-backed second territory, and the valuation bridge now rests on HUI’s ability to capture fees, management income, protected carry and certificate-priced offtake economics.
The core change is that certificate uplift is no longer a vague add-on. Under the UK SAF Mandate, obligated fuel suppliers need compliant SAF certificates or face buy-out economics.17,49 HUI does not need to receive the certificates directly: the project/SPV can benefit if eligible offtakers price the wholesale fuel package to reflect certificate value.20,33 That is why the US$500/bbl certificate-equivalent proxy matters — it is a mandate-informed buyer-avoidance value, not arbitrary premium pricing, and it sits below the statutory buy-out reference used in the full note. See Appendix C for the certificate-pricing matrices and Appendix D for the fee/carry treatment.
Single KSA bridge case
Value before UK / platform
Price Target Range on 556m diluted share count
Interpretation
Core KSA fee + carry
c.US$71m–US$117m
c.9.4p–15.4p
Base anchor-project economics before certificate uplift.
25% certificate capture
c.US$147m–US$193m
c.19.4p–25.5p
Current 12–18 month working bridge if eligible offtake and SPV capture are evidenced.33,49 See Section 3.4 and Appendix C.
50% certificate capture
c.US$223m–US$269m
c.29.4p–35.5p
Stronger offtake / pass-through case.
100% certificate pass-through
c.US$374m–US$420m
c.49.3p–55.4p
Top single-project sensitivity before UK DCF or platform value.
Pricing reference
US$/bbl or reference
£/litre equivalent / interpretation
HUI KSA physical-fuel proxy
c.US$260/bbl midpoint
c.£1.20/litre; base physical-fuel proxy before certificate uplift.
HUI certificate-equivalent proxy
US$500/bbl
c.£2.31/litre; mandate-informed offtake-pricing sensitivity, not guaranteed revenue.
HUI fully bundled reference
c.US$760/bbl
c.£3.50/litre before leakage, sharing, eligibility and SPV terms.
UK main-obligation buy-out reference
c.US$1,019/bbl
£4.70/litre statutory buy-out reference; compliance-cost ceiling, not HUI revenue.
The short-note conclusion is that HUI is still evidence-gated, but the market mechanism now makes the valuation kicker easier to understand. The buyer needs certificates, the buy-out reference creates a visible compliance ceiling, the buyer gains against the full penalty cost of not buying SAF. HUI’s waste-feedstock economics may allow competitive supply below that ceiling, and the model discounts the upside through staged 25%, 50% and 100% capture cases rather than assuming full pass-through today.
[Compliance cross-reference: This extract should be read together with the source notes and appendices supporting the numbered claims: KSA assumptions and cost stack in Appendix A; technology and scale evidence in Appendix B; certificate-pricing and carry matrices in Appendix C; fee, management-income, carry and waterfall treatment in Appendix D; UK policy support in Appendix D1; and pipeline / repeatability framing in Appendix E].
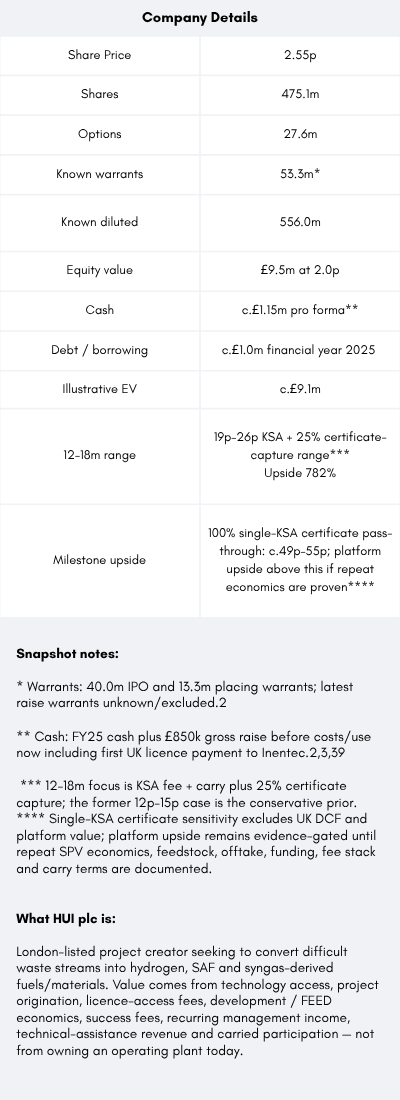
Today’s price 2.55p
12-18m price range target 19-26p (mid 22.5p)
Upside 782%
Section hook and takeaway: HUI has moved from broad hydrogen optionality to a more investable economic architecture. The important shift is not just more newsflow; it is the emergence of a route from waste feedstock to SAF demand, certificate-priced offtake, fee/carry economics and UK-policy optionality. The takeaway is that the current thesis should be read as an evidence-led valuation framework, with KSA as the first proof point and the UK as a policy-backed route catching up behind it.
HUI’s history explains part of the current valuation discount, but it also explains why the current KSA/SAF configuration deserves a fresh look. The market previously had to discount unanswered questions around project economics, fee entitlement, carry protection, licence structure, ownership mechanics, project funding and shareholder value capture. That discount was rational: HUI and the wider market were still searching for bankable hydrogen-adjacent end uses rather than valuing a clearly defined economic architecture.
This discount also reflected HUI’s listing / RTO-development journey, dilution over time and a series of earlier or deferred routes including own-technology and European development ambitions, Longford, North Macedonia, Ohrid / proprietary routes and other historical projects.5,6 Those references are context, not the current valuation engine. The Project Coverage Map and historical appendix retain the detail; the main body now focuses on why the KSA/SAF and UK-licence structure may represent a materially stronger economic route.
The investment case has now shifted. HUI is no longer asking investors to value generic hydrogen optionality alone. The stronger case is waste-derived syngas converted into mandated, transportable SAF and related fuels, with policy-backed demand, visible certificate economics and offtake support for project finance.10,17,33 HUI may retain licence-access fees, development / FEED economics, success fees, recurring management income, technical-assistance revenue and carried participation.
The hydrogen-market lesson is important: broad hydrogen narratives have struggled where demand, infrastructure, transport, storage and subsidy alignment were not yet bankable.15 SAF/waste-to-fuels is different because it links hydrogen-adjacent conversion technology to a mandated liquid-fuel market, scarce compliant supply, certificate-inclusive pricing and aviation offtake.17,18,20 The question for HUI is therefore no longer simply whether the technology is interesting, but whether the company can turn technology access, KSA progress, UK licensing, feedstock economics and protected fee/carry rights into attributable shareholder value.
The management-clarification table below summarises the practical consequence: fees, carry, ownership and certificates are now sufficiently defined to move the analysis from broad optionality toward economic architecture.10,33 UK policy support and execution evidence add the second-territory and bankability layers.39,40,41
The note considers all disclosed or recently discussed HUI project routes, but it values them selectively. Kingdom of Saudi Arabia (KSA) waste-to-sustainable aviation fuel (SAF) is the core DCF anchor10. KSA industrial hydrogen and modular repeat projects are adjacent platform options11. Oman8, UAE6, UK SAF39, PHE/Mithras13 and Fortress Fuel14 sit in the risk-weighted portfolio until binding economics are disclosed. Longford5, North Macedonia5, Ohrid5,6 and HUI proprietary technology are treated as historical or deferred routes.
Key Terms Used in This Note
SAF
Sustainable Aviation Fuel; drop-in aviation fuel that still requires pathway, specification, lifecycle and buyer acceptance.
FEED
Front-End Engineering Design; bankable engineering definition before construction.
FID
Final Investment Decision; the commitment point for funding and construction.
SPV
Special Purpose Vehicle; the project company through which fees, carry, debt, equity and cashflows may sit.
LCFF
UK Low Carbon Fuels Fund; grant/funding support for low-carbon fuel projects.
RCM
Revenue Certainty Mechanism; potential UK revenue-stability support for eligible SAF production.
ASTM
American Society for Testing and Materials / ASTM International; aviation fuel-specification framework relevant to drop-in fuel acceptance and approved SAF pathways.
CORSIA
Carbon Offsetting and Reduction Scheme for International Aviation; international aviation emissions and lifecycle-accounting framework relevant to SAF eligibility.
FT-SAF
Fischer-Tropsch Synthetic Aviation Fuel made from syngas and upgraded into jet-range products.
HEFA
Hydroprocessed Esters and Fatty Acids; currently dominant SAF pathway using oils/fats but constrained by eligible feedstock.
Where to find the detail: Appendix A covers SAF competitiveness and cost-stack support; Appendix B covers technology and scale evidence; Appendix C contains certificate-pricing sensitivities and certificate-capture matrices; Appendix D1 summarises UK policy support including LCFF / RCM.
Model discipline: unless otherwise stated, all project-value and valuation-range outputs in this note remain subject to the five rules below: attributable HUI economics, confirmed fee/carry rights, feedstock/offtake bankability, project financing, and repeatability evidence. Later sections rely on this discipline rather than repeating the full caveat each time.
Valuation discipline
1. Project scale is not shareholder value: do not value capex or project size directly; value HUI’s retained fees, carry and distributions.
2. TRL9 reduces technology-discovery risk, not integration risk: InEnTec may be proven at PEM level7,8, but FEED, engineering, certification and scale-up remain relevant.
3. MoUs increase probability, not cash flow: SIRC8,9, Hydrogen Systems11, RECYCLEE12 and PHE/Mithras13 are evidence of probability, not substitutes for binding terms.
4. Fees, management income and carry must be separated: pre-revenue fees can reduce dilution, the 2.5% operating-management fee begins with revenue, and carry remains a separate SPV participation right.
5. Repeatability is valuable only if economics repeat: repeat projects should receive increasing value only when net fees, protected carry, funding, offtake and SPV terms are disclosed across more than one project.
The February 2026 KSA waste-plastics-to-SAF illustrative model is the key public numerical source for this note.10 It provides the operating assumptions used throughout the valuation work: 200,000–250,000tpa feedstock, c.US$50/t gate fee, US$0.06/kWh power, c.US$35m annual opex, US$105m–US$155m revenue, US$80m–US$130m EBITDA, 400,000–600,000 barrels of SAF output, US$800m capex, a 20% free-carry concept and a c.15-month shovel-ready target. Appendix A retains the detailed assumption stack, implied revenue-per-barrel bridge and cost-stack logic.
Area
Previous treatment
Updated understanding
Valuation impact
Fees
Illustrative US$1m–2m annual sensitivity; uncertainty around timing and net economics.
Management clarification points to a broader fee stack: licence-access fee, development fees, FEED/EPC economics, success fees, 2.5% recurring management fee and technical-assistance income.
Fee DCF becomes a central valuation layer, not a side sensitivity.
Carry
Delayed / subordinated / uncertain, with large waterfall haircuts.
Management has described a 20% carry with immediate participation, participation during repayment periods and repeatable structure.
Carry timing haircut should reduce materially if final documentation confirms participation from first project revenue / distributable cashflow and during repayment periods.
Ownership / cash route
Earlier uncertainty over whether value might leak through territory subsidiaries, SPVs or third-party structures.
Management clarification indicates HUI KSA is 100% owned by HUI plc; UK licence rights are held within the group; and the ownership-chain discount should therefore be materially reduced, subject to cash-route mechanics.
Reduces ownership-leakage discount; remaining questions are recipient entity, SPV terms, tax, withholding, third-party pass-throughs and net remittance to HUI plc.
Certificates
Treated as uncertain and possibly already embedded in revenue.
Management has clarified that the US$105m–155m KSA revenue range should be treated as the physical-fuel base case and does not include SAF certificate uplift; certificate value should be modelled separately only where eligible export, offtake or pricing structures capture it.
Certificate sensitivity becomes a major upside bridge if captured through realised offtake pricing or separate project revenue, but it must not be double-counted inside the base KSA revenue range.
UK
Conceptual repeatability option.
Licensed UK territory with SAF Mandate, LCFF and RCM policy framework.
UK moves from broad option value to policy-backed platform opportunity.
Execution / integration
MoU and partner evidence, but still mostly internal project framing.
IO Consulting / EPC / integration workstream and Hydrogen Systems’ EPC-performance role improve external validation.
Probability weighting improves, but DCF value still requires funded FEED and project terms.
Milestone discipline: the RNS reference to a potential shovel-ready stage should not be read as revenue, construction completion or financial close. The value-changing milestone before FID is funded FEED with explicit HUI fee/carry economics, because that would show HUI can monetise its role while preserving project participation. Evidence should progress through site, feedstock, engineering, EPC/O&M, permitting, offtake, certification and finance before the market assigns fuller project value.
Section hook and takeaway: KSA is the economic anchor because it combines waste scale, low-cost inputs, circular-economy policy, fuel-security relevance and institutional alignment. This section explains why Saudi Arabia is the first serious test of HUI’s platform rather than just a geographic opportunity. The takeaway is that KSA supplies the core DCF route, the first bankability test and the first chance to prove repeatable HUI-level economics.
Saudi Arabia is the logical anchor market because waste-to-SAF sits at the intersection of waste management, circular-economy policy, aviation growth, fuel security and industrial localisation.10,17,18 The KSA opportunity should therefore not be viewed as routine market entry by a small foreign-listed developer: MISA registration, HUI KSA formation, RDIA recognition, SIRC/Masab engagement, waste-sector relevance and aviation/fuel-security context all support the KSA anchor case.8,9,10
Strategic partner involvement would be a major confirmation accelerator if it advances site selection, feedstock access, offtake, project-finance and repeatability discussions. The first KSA project is therefore important both as the economic anchor and as proof that HUI can originate, structure and retain value across Saudi Arabia and potentially wider MENA opportunities.8,9,10
Section hook and takeaway: SAF is the demand mechanism that turns waste-to-fuels from a thematic technology story into a mandated liquid-fuels market. Obligated fuel suppliers need compliant SAF certificates or face buy-out economics; HUI’s pricing power comes from supplying eligible non-HEFA / recycled-carbon barrels below that compliance ceiling if certification and offtake routes are proven.49 The takeaway is that certificate value is not automatic, but it becomes highly material if eligible offtake, lifecycle treatment and SPV capture are documented; Appendix C carries the detailed certificate-pricing matrices, Appendix A supports cost-stack competitiveness, Appendix B supports technical scale and Appendix D1 explains UK policy support.
SAF demand is increasingly mandated rather than discretionary. Aviation needs drop-in liquid fuels for long-haul decarbonisation, and UK / international policy is pushing demand through statutory mandates, certificates, airline obligations and emerging revenue-support mechanisms.17,18,20 The investable issue is therefore shifting from demand creation to whether enough compliant SAF can be produced, certified, financed and sold into eligible offtake channels.

SAF refuelling: SAF is a drop-in, transportable aviation-fuel market once certification and buyer requirements are met.
KSA and the UK now play different but complementary roles. KSA is the low-cost production engine: scale, low-cost power, waste feedstock, gate-fee potential and industrial-policy support.10,23 The UK is the higher-value policy-backed demand market: statutory SAF Mandate demand, certificate economics, LCFF support and potential RCM-backed financeability.17,40,41 The strongest interpretation is not KSA versus UK, but KSA supply sold into or priced against eligible policy-backed markets where contracts allow.
Offtake should be seen as more than physical fuel purchase. A credible counterparty may support marketing and distribution, certification route, logistics, credit quality, pricing formula and certificate-inclusive wholesale pricing. That improves bankability and may become the route through which certificate value is captured by the project rather than treated as a separate theoretical line.17,20,33
The feedstock and cost-advantage argument is central. HUI’s route targets difficult residual waste streams that may attract gate-fee or waste-solution revenue, while some competing SAF pathways must pay for scarce or politically sensitive biological, crop or premium waste feedstocks.10,20,21 The KSA model’s cost edge therefore depends on FEED validating net gate-fee treatment, feedstock quality, sorting, power, conversion, co-products and offtake, rather than on assuming maximum SAF premiums.23,27,33
Detailed price and cost comparisons sit in Appendix A. The main-body conclusion is that the KSA implied operating cost appears materially below current SAF market indications and published FT-SAF cost references if FEED validates gate fee, power, conversion, co-product and offtake assumptions.
The KSA RNS economics remain the core production anchor. The disclosed model assumes:
KSA base case item
Public model basis
Revenue
US$105m–155m pa
Output
400k–600k bbl pa
Opex
c.US$35m pa
EBITDA
c.US$70m–120m pa
Midpoint revenue / barrel
c.US$260/bbl
Management has clarified that the US$105m–155m revenue range should be treated as excluding SAF certificate uplift. That is an important change in interpretation. The published KSA model should therefore be treated as the physical-fuel base case, while certificate-enhanced pricing should be modelled separately as export-linked / offtake-pricing upside and not as part of the base revenue range.
Certificate value should not be automatically added to every KSA barrel, and direct UK RCM support should not be modelled as a KSA revenue line. The tighter distinction is that KSA-produced SAF does not qualify for UK RCM as project support, but compliant KSA SAF may still be exported into, sold into or contractually priced against UK-linked or other certificate-eligible demand. Management’s implied offtaker thesis is therefore not that KSA receives UK RCM; it is that scarce compliant supply may allow offtakers to trade at certificate-equivalent or RCM-informed pricing and leave some or all of that uplift with the project/SPV if agreed in the offtake terms. RTFO-style renewable-fuel mechanisms are relevant as UK policy architecture history, but SAF valuation should now be read through the SAF Mandate / certificate framework rather than old RTFO assumptions.17,42 Appendix C provides the detailed certificate-pricing matrices used for this note.
Mandate-pricing worked example: the UK SAF Mandate gives the buyer a visible compliance alternative. A fuel supplier that cannot source enough eligible SAF can pay the buy-out instead of presenting certificates; the official buy-out levels are equivalent to £4.70/litre for the main obligation and £5.00/litre for the PtL obligation.49 That does not mean HUI receives the buy-out price. It means the buyer compares compliant SAF pricing with the cost of ordinary jet fuel plus the buy-out. At 159 litres per barrel, the £4.70/litre main-obligation buy-out is c.£747/bbl, or c.US$1,019/bbl at US$1.3640/£. HUI’s US$500/bbl certificate-equivalent modelling proxy is c.£367/bbl or c.£2.31/litre, well below that statutory buy-out ceiling. The point is therefore not arbitrary overpayment: it is mandate-informed buyer-avoidance economics, subject to eligibility, lifecycle treatment, offtake terms and SPV-level capture.
The correct modelling treatment is:
Route
Production economics
Policy / certificate economics
Model treatment
KSA domestic / GCC SAF
Low-cost production, gate fee, cheap power, scale
No automatic UK certificate or RCM assumption
Use RNS revenue range unless offtake proves higher realised price
KSA SAF exported or priced into UK-linked demand
KSA low-cost production
Potential UK-linked certificate / mandate pricing if accepted by buyer or regime
Model as export-mix sensitivity on top of base revenue
UK-produced SAF
Potentially higher UK cost base
UK SAF Mandate, certificates, LCFF and RCM if eligible
Build a separate risk-weighted UK DCF once scale / capex / offtake are defined
This avoids double-counting. In practice, certificate-equivalent value may appear inside the realised wholesale / offtake price rather than as a separate certificate cheque. If that value is embedded in the SAF price, it belongs in realised project revenue and should not also be added as a separate certificate line. If certificates are separately issued to or passed to the SPV, they can be treated as a separate project revenue line. In either case, the model separates physical-fuel base revenue from certificate-equivalent uplift only to show the incremental sensitivity and the same economic value should not be counted twice.17,20,33,49
Section hook and takeaway: This is the numerical proof engine for the first KSA project. It separates core fee/carry value from certificate-capture sensitivities and deliberately excludes UK and platform value. The takeaway is that the 19p–26p 12–18 month price-target range is not a broad hope case; it is the core KSA fee/carry bridge plus a limited 25% certificate-capture sensitivity, subject to eligible offtake, SPV capture and documentation; stronger offtake evidence and clearer certificate-value pass-through are the milestones that could move the model toward 50% or 100% capture.
The table below isolates the first KSA anchor project only. It bridges the updated fee-stack DCF, HUI free-carry DCF and certificate-uplift sensitivities before any UK DCF, multi-project platform value or strategic repeatability is considered. It is designed to show the scale of the single-project arithmetic, not to update the platform or headline valuation ranges at this stage.
Single KSA bridge case
US$ value before UK / platform
£ value at US$1.3640/£
Price target Range on 556m diluted share count
Certificate-uplift assumption
Treatment
Core KSA fee + carry case
c.US$71m–US$117m
c.£52m–£86m
c.9.4p–15.4p
None included; combines fee-stack DCF of c.US$19m–US$29m and HUI free-carry DCF of c.US$52m–US$88m.
Anchor-project economic bridge, subject to documented fee terms, carry waterfall, tax, leakage and net remittance.
25% certificate capture
c.US$147m–US$193m
c.£108m–£142m
c.19.4p–25.5p
HUI 20% carry exposure: c.US$12.5m pa illustrative certificate PV
c.US$76m.a,b,c
Conservative proof case: shows that even limited certificate capture is material where eligible export / certificate-priced offtake and SPV capture are evidenced.
50% certificate capture
c.US$223m–US$269m
c.£164m–£197m
c.29.4p–35.5p
HUI 20% carry exposure c.US$25.0m pa; illustrative certificate PV
c.US$152m.a,b,c
Credible upside case: reflects stronger offtake, pricing and certificate-capture evidence while remaining below the full pass-through sensitivity.
100% certificate pass-through
c.US$374m–US$420m
c.£274m–£308m
c.49.3p–55.4p
HUI 20% carry exposure c.US$50.0m pa; illustrative certificate PV
c.US$303m.a,b,c
Top single-project sensitivity: shows the scale of value if full certificate-equivalent pricing is captured through eligible offtake and project-level economics.
Table notes: a US$500/bbl is the Appendix C certificate-equivalent modelling proxy, not guaranteed revenue. b 500k bbl is the midpoint of the disclosed 400k–600k bbl KSA SAF output range. c Capture rows assume 100% eligible certificate-priced output for the stated capture percentage; annual HUI 20% carry exposure and illustrative certificate PV at 12% are derived in the worked example below. Capture depends on eligible offtake, lifecycle treatment, certificate-value pass-through and SPV-level economics; the table separates the uplift from physical-fuel base revenue to avoid double counting.
Base case before certificates: the core KSA fee + carry bridge already gives c.US$71m–US$117m, or c.9.4p–15.4p price target range per share, before any certificate uplift, UK DCF or platform value. Within that range, the intended Year 3 early-distribution carry case is c.US$88m before certificates, while the lower carry outcomes are timing / loan-sweep sensitivities retained in Appendix C. The 19p–26p 12–18-month case therefore reflects the base fee + carry bridge plus an effective 25% certificate-value case, not a standalone certificate assumption.
25% certificate working example: 500k bbl × US$500/bbl × 25% = US$62.5m incremental project uplift. Applying HUI’s 20% carry gives c.US$12.5m pa before tax, leakage and waterfall effects. Discounting that annual exposure at 12% over the 30-year operating life, with the same first-year 50% ramp-up assumption used elsewhere, gives an illustrative certificate PV of c.US$76m. Adding that to the core KSA fee + carry bridge of c.US$71m–US$117m gives c.US$147m–US$193m before UK DCF, second-project value, multi-project platform value or strategic replication. At US$1.3640/£ and ~556m diluted shares, that equates to c.£108m–£142m, or c.19.4p–25.5p per share.
Discount-rate clarification: project-level economics in this note use the 10% project discount rate, while HUI carry / distribution exposure is valued using the 12% HUI distribution discount rate. HUI carry is calculated from HUI’s 20% share of the relevant cash-flow stream, not by taking 20% of the 10% project DCF. This distinction explains why Appendix C shows project-level DCF and HUI carry/distribution PV separately.
FX sensitivity note: applying US$1.3640/£
This section deliberately excludes UK DCF value, second-project value, multi-project platform value and strategic replication. KSA SAF can qualify for certificate economics if compliant production is exported into, sold into or contractually priced into UK-linked or other eligible certificate channels, subject to eligibility, offtake terms and SPV-level capture being documented.17,20,33,49 The bridge above should therefore be read as a single-project sensitivity before UK and platform value: 25% capture is the current working bridge, while 50% and 100% capture require progressively stronger evidence that certificate-equivalent value passes through the realised offtake price or project revenue line.
Incremental fee note: if certificate value is captured as realised project revenue, HUI’s 2.5% operating-management fee may also scale with the higher revenue base, subject to the final fee definition, payer and recipient entity. That incremental fee effect is not included in the certificate carry sensitivities unless separately stated.
The UK project is earlier than KSA but no longer merely conceptual. The UK licence, mandate-backed SAF demand, LCFF funding routes, certificate economics, potential RCM support and IO involvement make it a relevant second-territory option. For now, the UK DCF should remain indicative rather than core value: KSA is the low-cost production anchor, while the UK has the stronger policy-pricing and revenue-certainty stack. The practical modelling guardrails are:
The UK opportunity should be treated as economically different from KSA, not merely as another deployment geography. KSA has the stronger low-cost production profile, while the UK has the stronger policy / revenue-certainty profile. Fortress Fuel is outside this comparison.
Economic factor
KSA SAF project
UK SAF project
Modelling implication
Base operating economics
Lower forecast capex, land, power and utility costs.
Higher UK cost base expected.
KSA remains the low-cost production engine.
Power / lifecycle-emissions context
Renewable power must be specifically acquired, which may increase capex or opex if outsourced.
UK grid is substantially decarbonised and should be more decarbonised by the time a plant operates.
UK may have a lifecycle-emissions / power-sourcing advantage despite higher cost.
SAF Mandate certificates
Available if KSA-produced SAF is distributed into the UK and meets eligibility requirements.
Available for eligible UK-produced SAF.
Certificates are not UK-only if compliant KSA fuel is sold into the UK; model through offtake and certificate capture.
Distribution / offtake route
Planned distribution into UK channels; distribution costs higher than UK production but not expected to be significant.
UK-based production serving UK offtakers / end-users.
UK-based offtakers and end-users may be common to both routes.
RCM support
Not available to KSA SAF.
Potentially available to eligible UK SAF projects as a 15-year revenue-certainty / bankability contract, subject to allocation and contract rules.
RCM should remain UK-only and should not be layered into KSA revenue or certificate sensitivity; KSA uplift must be through eligible offtake / certificate-equivalent pricing if contractually captured.
Bankability profile
Stronger cost competitiveness and scale economics.
Stronger policy / revenue-certainty framework through LCFF and potential RCM.
UK should be valued as a different economic profile, not just geographic repeatability.
Section hook and takeaway: The UK is no longer just optionality; it is a licensed, policy-backed second territory that may be catching up with KSA on evidence milestones. The SAF Mandate is the current certificate regime, LCFF is a scheme-specific grant / development-support route HUI is exploring, and RCM is a separate potential revenue-certainty / bankability mechanism for eligible UK production. The takeaway is that LCFF progress would be meaningful because it could move the UK project from licensed option toward externally supported development work; the funding support is rule-specific and Appendix D1 explains the mechanism architecture.
The UK licence materially improves the quality of the UK opportunity. HUI now has licensed rights to deploy InEnTec PEM gasification technology across the United Kingdom for SAF production.39 The UK case is therefore no longer conceptual optionality alone. It remains earlier than KSA, but it is now a licensed, policy-backed platform option with a defined technology route and a clearer pathway to development evidence.
The UK also has a stronger policy / revenue architecture than many jurisdictions, but the mechanism chronology matters. Earlier grant or renewable-fuel references should not be treated as live, interchangeable support: AFF has been superseded by LCFF where applicable, and RTFO-style renewable-fuel architecture is legacy policy history for SAF analysis because SAF is now governed through the SAF Mandate / certificate regime.17,40,42 LCFF is a potential project-support route that HUI is exploring, while RCM is a separate potential 15-year revenue-certainty / bankability contract framework for eligible UK SAF production.39,40,41 These routes are scheme-specific, with separate eligibility, timing, application, allocation and contract requirements, so valuation relevance comes from milestone evidence rather than from assuming public support is automatically available.
The practical funding distinction is therefore important. LCFF should be treated as potential investment aid / development-support funding for eligible low-carbon fuel work, not as recurring operating revenue; RCM should be treated as a potential 15-year revenue-certainty / bankability contract for eligible UK SAF production, not as an automatic uplift and not as part of the KSA case. Where awarded, a 15-year RCM contract could support revenue certainty for roughly half of the 30-year operating-life framework used in this note. That matters because it reinforces the durability of the UK SAF policy stack: the SAF Mandate creates the certificate obligation and buy-out economics, while RCM is designed to improve bankability for eligible UK production. For KSA, the read-through is not direct RCM support; it is that the same mandate / buy-out architecture helps define the buyer’s compliance alternative and therefore supports certificate-equivalent offtake pricing if eligible imported SAF is contractually captured. National Wealth Fund should be treated only as broader strategic-capital context unless a specific HUI funding route, allocation or counterparty is disclosed.43 The UK valuation should therefore stay evidence-gated: site, scale, feedstock, planning, capex, offtake, LCFF / RCM eligibility and SPV economics must be documented before fuller UK DCF credit is appropriate. Appendix D1 summarises this UK funding and policy-support architecture.
KSA remains the core valuation anchor, but the UK has become commercially relevant.10,39 The UK licence, SAF Mandate, LCFF and possible RCM support create a second policy-backed route that could progress as site, feedstock, offtake and funding milestones build.17,40,41
Management comments suggest the main UK execution issue is site / location availability rather than pathway eligibility, refinery integration, ASTM acceptance or other binary technical risks.39 Site selection is ecosystem selection: waste access, gate-fee potential, grid/power, planning, utilities, logistics, product offtake, certificate eligibility, LCFF/RCM fit and SPV economics all need to align.17,40,41
Appendix E provides supporting detail on UK industrial-cluster examples. The main-body conclusion is that UK brownfield industrial clusters make a waste-to-SAF location strategy plausible if site, planning, feedstock, offtake and SPV terms are secured.
Section hook and takeaway: Bankability depends on whole-facility integration, not only on proven component technology. IO Consulting matters because the project must connect feedstock handling, PEM gasification, syngas clean-up, downstream conversion, certification inputs, utilities and offtake into a financeable facility design. The takeaway is that IO scope, funded pre-FEED / FEED, SPV funding and partner guarantees are the evidence that can move HUI from credible concept toward bankable execution.
IO Consulting should be presented as HUI’s whole-facility technical integrator, not as a generic adviser. IO has been engaged to manage integration of the overall facility and to help move the project from concept validation toward bankable definition.48
Its role covers the full system: feedstock reception, InEnTec PEM gasification, gas clean-up, downstream conversion, upgrading, utilities, support systems, certification inputs and product offtake. That matters because the investment question is whole-facility integration, not one isolated unit operation.33
Unit licensors and specialist technology providers remain responsible for their own process data, equipment design basis, performance assumptions and process guarantees. IO’s role is to integrate those packages into a coherent facility-level design and advise HUI on how the individual guarantees, interfaces and operating assumptions combine into overall project-performance assurance.22,33,48
IO’s role evolves across the project lifecycle: feasibility validation and LCFF support first, then pre-FEED / FEED, front-end engineering definition, interface management, cost and schedule development, and ultimately owner’s technical support during EPC.46,47 Funding should also evolve, with HUI plc supporting early feasibility work, project-specific pre-FEED / FEED expected to sit with the relevant SPV, and LCFF or grant funding potentially paying for approved IO scope if awarded.40,48
IO also has relevant scale and sector credibility. Public material supports IO’s Power-to-X, SAF, hydrogen and e-fuels experience.44,45 Further material supports IO’s PreFEED, FEED, owner-side project-definition and Project Starling-type credibility.46,47 The recent HUI / IO RNS provides the project-specific link through IO’s role supporting HUI’s waste-plastic-to-hydrogen and waste-plastic-to-SAF projects.48 Appendix B and the source notes provide supporting detail on IO’s relevant scale and sector credibility. The confirmation path is clear: disclosed IO scope, SPV funding, grant allocation and project terms would convert this integration role into stronger valuation support.
Section hook and takeaway: A recognised downstream licensor or process partner would be more than a supplier announcement; it would be a validation event for syngas-to-SAF conversion. This section explains how fuel-processing, catalyst, product-finishing and certification support can reduce lender and integration concerns. The takeaway is that this partner layer could materially de-risk the route from InEnTec syngas to accepted aviation fuel, but only once scope, guarantees, funded work programme and commercial terms are disclosed.
A recognised tier-one downstream process licensor would be more than a supplier appointment. It would be an industrial validation event, showing that HUI’s InEnTec syngas route can be combined with established downstream fuel-processing technology across syngas conditioning, Fischer-Tropsch synthesis, upgrading, hydroprocessing, catalyst systems and product finishing.22,31,33
A tier-one licensor can also support the certification pathway. Its role can include product-specification alignment, fuel-finishing design, ASTM pathway confidence, test-data requirements, mass-balance evidence and lifecycle inputs.17,22 The licensor does not replace formal project certification, but it can make the syngas-to-fuel chain more credible for certifiers, offtakers and fuel suppliers.20,33
For lenders and project-finance advisers, proven process licensors matter because they bring reference-plant experience, catalyst supply arrangements, process guarantees, performance warranties and EPC compatibility. Their involvement can reduce the perceived integration-risk gap between feasibility work and a financeable waste-to-SAF project, particularly across syngas conditioning, FT synthesis, upgrading, utilities, product finishing and offtake acceptance.20,33,48
A recognised downstream licensor would support the next validation step: process scope, guarantees, funded work programme, SPV role and commercial terms.33,48 Disclosure of those items would strengthen the link between industrial credibility, certification support, lender diligence and the valuation framework.
Section hook and takeaway: The technology story is no longer simple invention risk; it is a train-scalability and integration test. InEnTec PEM evidence supports the physical route, but HUI’s KSA proof case is the proposed five-unit configuration: five x 125tpd modules operating at 360 days would process c.225,000tpa, broadly matching the RNS 200,000–250,000tpa feedstock range. The takeaway is that FEED must still prove the complete multi-train waste-to-SAF plant, but the five-module scale reconciliation makes the KSA model coherent enough to analyse and is the practical bridge to repeatable modular deployment if one plant works. The risk is current commercial projects run on 25tpd modules; scalability needs proving.
Plasma gasification matters because it broadens the feedstock universe. Instead of competing only for scarce HEFA feedstocks, HUI’s route targets difficult mixed plastics, tyres and residual waste streams22 that conventional recycling, landfill and incineration struggle to solve. The investment relevance is not the plasma physics; it is whether a modular high-temperature conversion system can turn low-value or gate-fee waste into clean syngas suitable for hydrogen, SAF and other fuels23, while also producing a vitrified, non-toxic glass-like mineral residue22 that may have use as aggregate or other building-sector material where specifications allow.
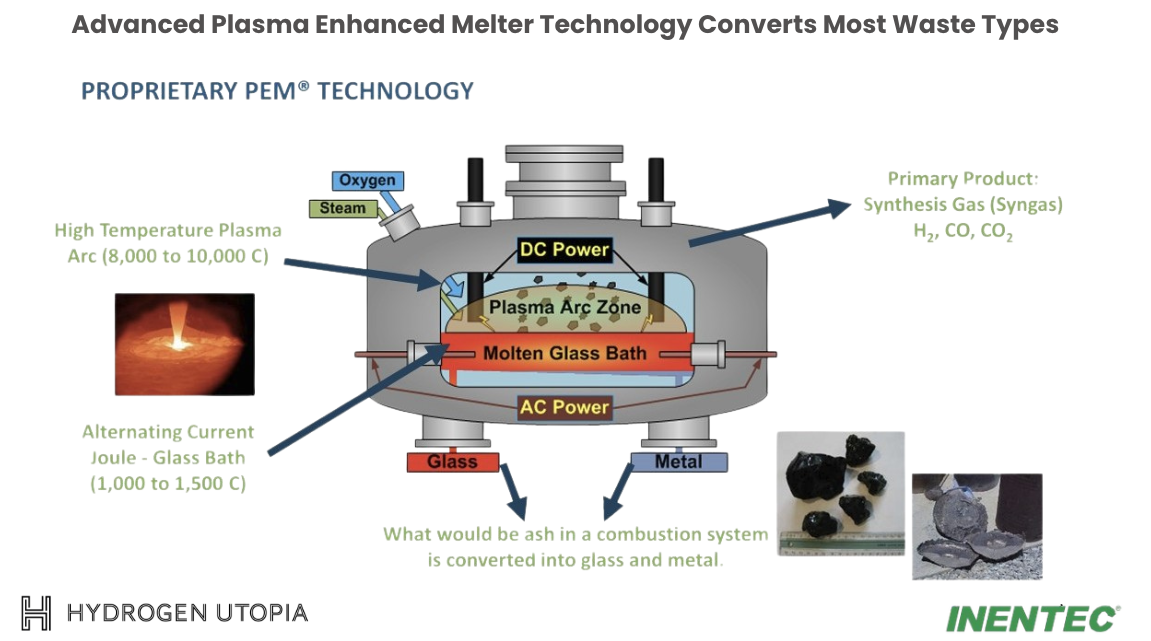
InEnTec PEM process: residual waste is converted into syngas before downstream upgrading into SAF, diesel, naphtha and other products.
The core technology may be TRL9 at the PEM-train level22, but the proposed KSA waste-to-SAF plant remains an integration and scale-up challenge. FEED must prove the number of trains, feedstock handling, syngas cleaning, FT/upgrading, utilities, uptime, capex, certification and offtake route10,22. Readers seeking detailed science can use HUI and InEnTec technical materials; this note focuses on whether the system can be scaled, warranted, certified and financed.
Presentation scale reconciliation: HUI KSA presentation material22 gives useful unit-level scale context. It states that each InEnTec Unit / PEM module processes approximately 125 tonnes per day for 360 operating days22, or roughly 45,000 tonnes per annum. A five-unit configuration would therefore process around 225,000 tonnes per annum, broadly matching the later RNS KSA model’s 200,000–250,000 tonnes per annum feedstock range.
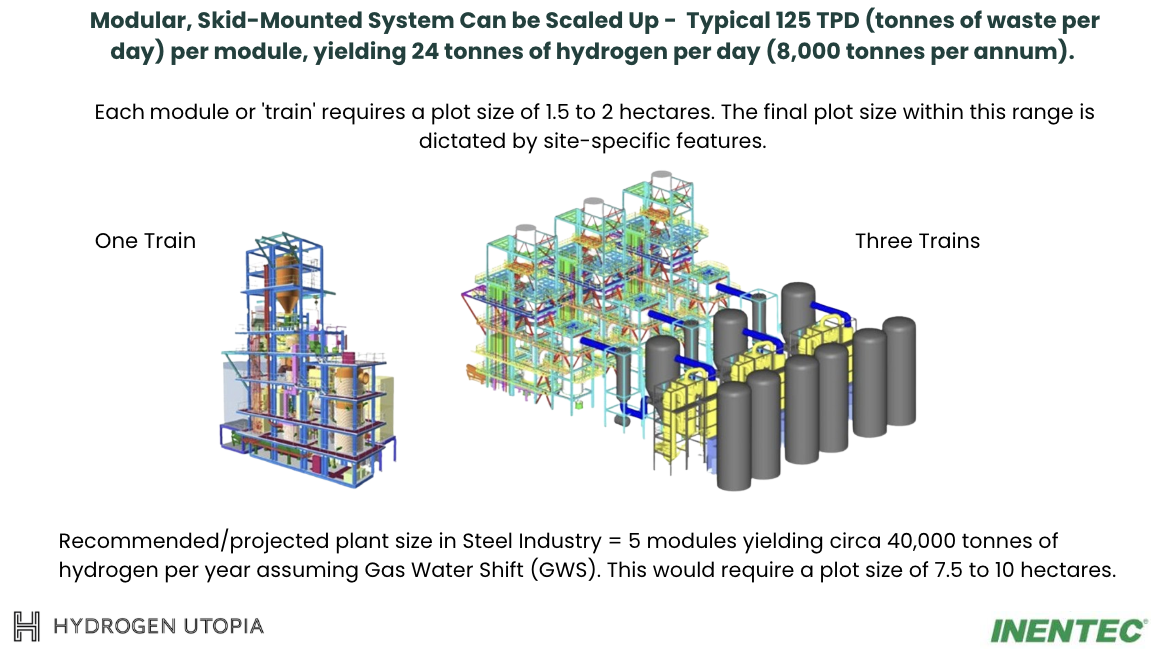
InEnTec modules / trains: supports the 125tpd, 360-day and five-unit scale reconciliation used in the KSA model discussion.
The hydrogen-to-SAF arithmetic also reconciles directionally. HUI presentation material indicates c.24 tonnes of hydrogen per day, or c.8,000 tonnes per annum, per unit assuming water-gas shift; five units therefore imply c.40,000 tonnes per annum. External synthetic-fuel benchmarks imply roughly c.36,000–42,000 tonnes of hydrogen for 600,000 barrels of finished fuel. This supports the scale logic, while FEED still needs to define syngas yield, H₂/CO ratio, water-gas shift, Fischer-Tropsch conversion efficiency and product split.
That reconciliation improves confidence in the physical scale logic, but it does not eliminate integration risk. The presentation also references InEnTec Columbia Ridge and Dow Corning Corporation as 25 tpd commercial-scale facilities22. The KSA case therefore requires scale-up from cited 25 tpd references to 125 tpd units, and then integration of multiple units with gas clean-up, water-gas shift, Fischer-Tropsch synthesis, upgrading, utilities, certification and offtake.
Section hook and takeaway: The remaining technology risk is whole-system execution. TRL9 PEM-train evidence reduces technology-discovery risk, but it does not prove a multi-train KSA SAF facility across feedstock, syngas clean-up, FT/upgrading, uptime, utilities, certification and offtake. The takeaway is that phased modular deployment may be more valuable than one oversized first plant if it proves repeatable performance, fees and carry across more than one SPV.
The Air Products Teesside experience24 is a useful cautionary lens: very large first-of-kind or heavily integrated projects can suffer from scale, integration, procurement and contracting risk24. HUI’s stronger strategic case may therefore be a phased modular deployment model rather than a single oversized first plant.
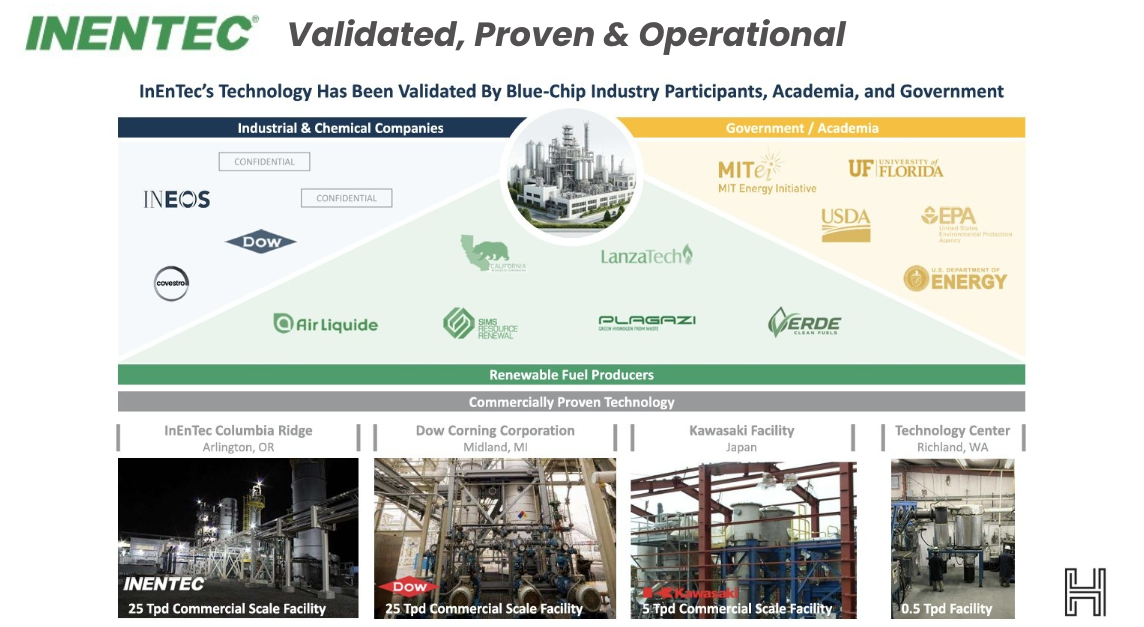
Commercial scale bridge: Columbia Ridge / Dow Corning references help frame the scale-up from 25tpd references to 125tpd KSA units.
Scale-risk conclusion: one US$800m anchor plant gives the biggest headline economics but carries higher first-project integration and schedule risk. Phased multi-train or medium-scale SPVs may offer better risk-adjusted proof because HUI can demonstrate performance, refine integration and repeat fees/carry across more than one funded project.
This shifts the valuation question from “how large can the first plant be?” to “how many economically repeatable modules or medium-scale SPVs can HUI originate while retaining net fees and carried economics?” If a strategic KSA partner prefers several medium-scale plants or phased multi-train deployment, that could reduce execution risk and increase the probability of repeatability, even if the first project’s standalone DCF is smaller.
InEnTec reduces technology-discovery risk, but HUI must still prove multi-train integration, SAF pathway execution and project-finance readiness. This nuance is essential because the company’s strongest valuation case depends on repeatability: if one KSA project works, the platform value rises sharply; if scale-up requires extensive redesign, the carry should be discounted more heavily.
Section hook and takeaway: KSA execution risk is now about delivery evidence: local EPC/O&M support, feedstock aggregation, waste-sector alignment and bankable project terms. Hydrogen Systems, RECYCLEE and SIRC/Masab each address a different execution question, but none removes the need for definitive agreements, guarantees, net gate-fee treatment and SPV funding. The takeaway is that 5.4 is the practical de-risking section: who builds it, who supplies the waste, and how the economics become financeable.
Two later KSA announcements improve the execution bridge but do not yet remove bankability risk. The Hydrogen Systems MoU adds a named local EPC/O&M and hydrogen-infrastructure partner31, while the RECYCLEE MoU directly addresses feedstock aggregation for the proposed Jubail facility32. Both are non-binding31,32, but they are relevant because they map onto the two questions investors will ask first: who can deliver the plant, and where does the waste come from?
KSA execution de-risking: Hydrogen Systems adds a named local EPC/O&M and hydrogen-infrastructure partner31; RECYCLEE addresses the proposed 200,000tpa feedstock requirement32; SIRC/Masab aligns the project with the national waste-sector agenda8,9. The open questions are role, guarantees, definitive agreements and whether the gate fee is gross or net.
Hydrogen Systems is already in the KSA stack as a named local EPC/O&M and hydrogen-infrastructure partner, strengthening the project-delivery bridge. A further recognised EPC contractor, operator, strategic integration partner or guarantor would improve confidence in multi-train integration, uptime, process guarantees, certification evidence, commissioning and lender diligence, helping the project move from credible concept toward a financeable execution package.
The KSA base economics remain the anchor, but not the ceiling.10 Certificate uplift sits outside the published US$105m–US$155m physical-fuel revenue range and should be modelled only where eligible export, offtake pricing and SPV-level capture are documented.17,33 Management’s certification/pathway explanation reduces the risk that plastic-derived SAF is excluded in principle, but project-specific eligibility, lifecycle accounting, offtake acceptance and certificate capture still need to be documented. IO Consulting and any recognised downstream licensor reduce integration, certification and bankability haircuts, but the valuation discount should still focus on export mix, offtake pricing, certificate realisation, project-specific certification, UK scale and HUI economic capture.20,46,48
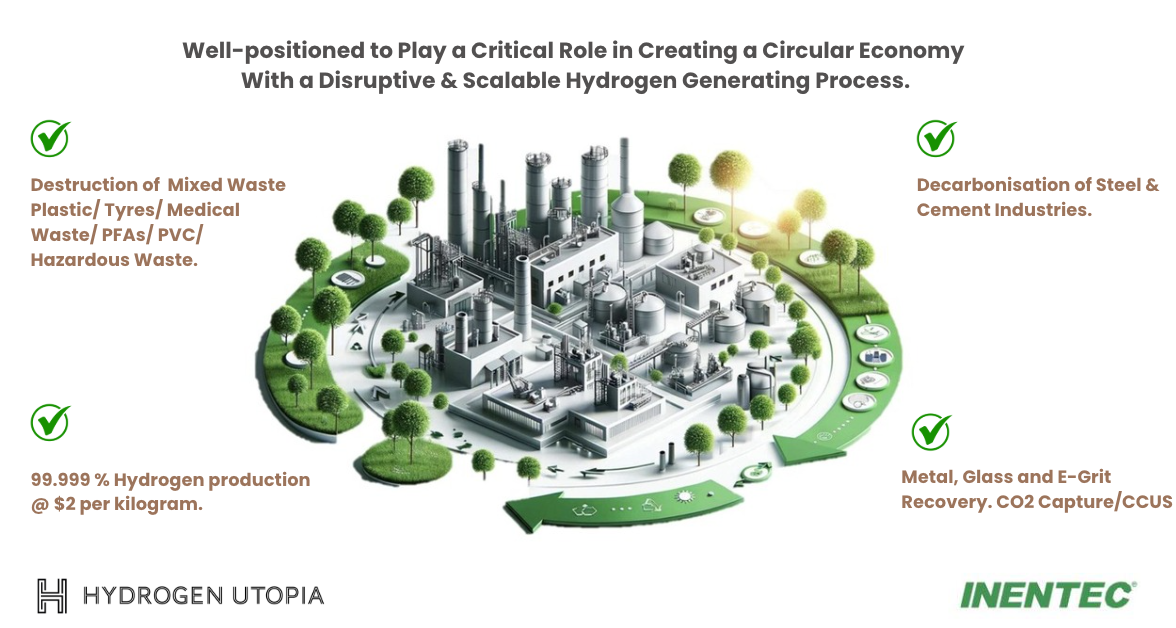
KSA circular-economy alignment: waste-to-fuels sits within Saudi recycling, industrial and decarbonisation priorities.
KSA waste-scale repeatability: HUI KSA presentation material links national problematic waste streams to implied InEnTec Unit deployment potential, including plastics, used tyres and medical waste.22 This supports the modular repeatability argument, but it should not be read as HUI capturing all national capacity. The relevance is that the first KSA project is being framed against a national-scale waste problem where repeatable sites, repeat fees and protected carry could matter if documented.
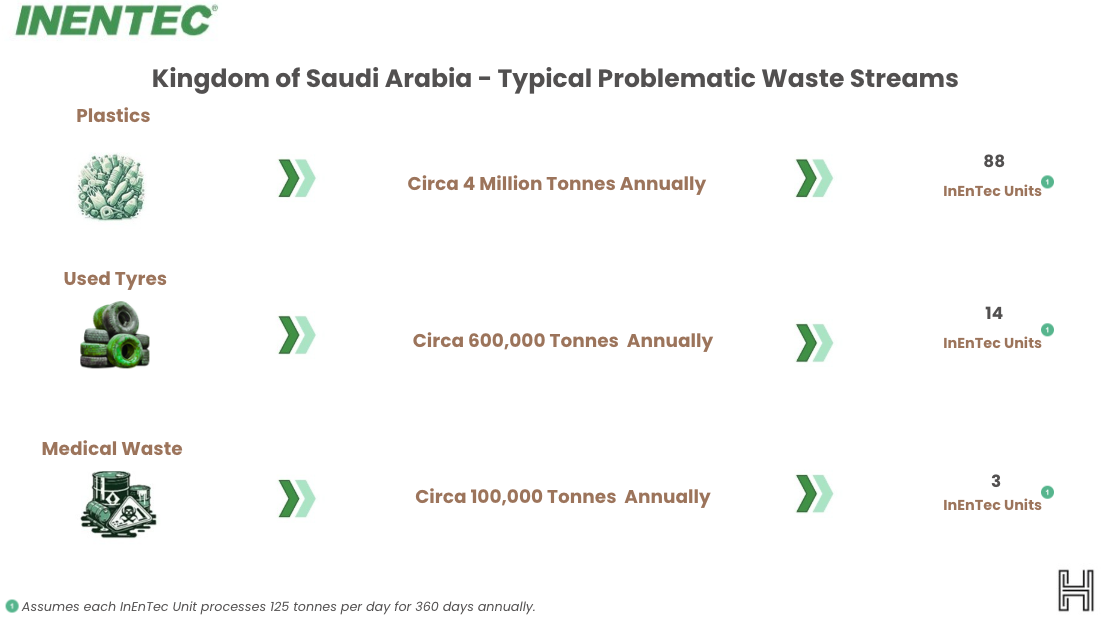
KSA waste-scale context: HUI presentation material links problematic waste streams to implied InEnTec Unit deployment potential.
Saudi counterparties are evaluating the project opportunity just as HUI is evaluating Saudi market fit.8,9,10 That mutual visibility is part of the option value and could shorten the path from strategic relevance to commercial validation if formal economics, counterparties and project terms follow.10,31,32
The KSA model is the only current route with enough public economics to support a core DCF. The headline RNS arithmetic is attractive: US$105m–US$155m revenue, US$35m opex, US$70m–US$120m EBITDA after normalising the stated ranges, and a 20% free-carry concept. Those figures provide the operating anchor for the valuation bridge.
The valuation bridge separates three layers: the project’s operating economics after capex, HUI’s 20% carry DCF, and HUI plc fee income that may reduce dilution before operating revenue begins.
Appendices C–D show why that separation matters: full project NPV is heavily affected by capex and timing, while HUI’s carry and fee layers can still be valuable if structured and documented as intended.
Layer
What it measures
Current treatment
RNS EBITDA attribution
20% × operating EBITDA.
Explains the US$19m base-case headline; excludes capex, tax, debt service and timing.
Full project DCF
Project value after US$800m capex and delayed revenue.
Used as a reality check, not directly attributable to HUI unless project terms are agreed.
HUI carry DCF
Value of HUI’s distributions under 20% carry assumptions.
Sensitive to revenue start, SPV waterfall, repayment-period treatment, dilution protection and legal documentation; delayed/subordinated carry is now a downside fallback rather than the live case.
HUI fee DCF
FEED, developer, management, licence-access or success fees.
Updated fee-stack DCF now incorporated; confirm amount, payer, recipient entity, seniority, tax, withholding, net remittance and any InEnTec / third-party pass-throughs.
Section hook and takeaway: Economic capture is the route from project success to HUI shareholder value. This section shows how pre-revenue fees, the 2.5% operating-management fee and 20% carry are separate value layers rather than one blended assumption; Appendix D provides the detailed fee, carry and waterfall support. The takeaway is that fees can support HUI before first fuel, while carry drives project upside once SPV economics are confirmed.
HUI creates value by controlling project gates that larger pools of capital need: technology access, feedstock, Saudi / UK platform position and certification pathway.7,8,9 Offtake relationships, project-capital entry points and policy-backed SAF demand add further gates to monetisation.10,17,20 The commercial question is how those gates convert into fees, management income and protected carried participation.11,18,19
The Single KSA Anchor-Project Sensitivity already shows the core KSA fee + carry bridge at c.US$71m–US$117m, or c.9.4p–15.4p per share, before certificate uplift, UK DCF or platform value. That is the pre-certificate HUI shareholder-value bridge: project economics become relevant because HUI may retain fees, management income and carried participation rather than funding or owning the whole US$800m asset.
Pre-revenue fees and the 2.5% operating-management fee can reduce dilution and create recurring revenue before or alongside carry distributions. Management clarification has answered several earlier thesis-level questions; detailed formal-proof sensitivities are now handled in Documentation Sensitivities, Risks and Appendix D / Appendix D1.
Section hook and takeaway: Funding is the bridge between better evidence and shareholder dilution, and the UK licence is also a repeat-project licence-fee marker. The US$500k InEnTec UK licence cost — US$250k upfront and US$250k by promissory note — shows that repeating territory / project rights can involve identifiable licence costs alongside HUI-originated fees and carry upside. The takeaway is that the next value-changing events are paid development work, funded FEED, LCFF or other grant progress where scheme-specific eligibility is met, repeat licence/site-right economics, and SPV-level capital that confirms HUI can monetise project creation without carrying the full plant-funding burden.
The FY25 results showed year-end cash of £500k, administrative expenses of £699k, operating cash outflow of £438k, intangible additions of £376k for the InEnTec PEM licence and borrowings of c.£1.0m.2 The later £850k raise increased shares in issue to 475.1m, while known options and warrants take the visible diluted base to c.556.0m before any undisclosed fundraise warrants.2,3 This capital should be read as milestone support rather than final project funding.
The £850k raise supports the next stage of evidence creation: Saudi expansion, Fortress Fuel, licence-extension work, UK licence obligations and funded development activity.3 Its value is highest if it helps HUI reach stronger disclosed terms — paid development work, funded FEED, clearer fee architecture, SPV documentation and offtake/certification progress — rather than simply extending near-term cash runway.
The 17 August 2026 UK SAF licence RNS also gives a useful repeat-project licence-fee reference as it mirrors the KSA metric. The UK InEnTec licence carries total consideration of US$500k, of which US$250k has been paid and the remaining US$250k is payable by promissory note; this should be treated both as cash-use / licence-obligation sensitivity and as evidence that future territory or site rights may carry identifiable licence costs before HUI-originated fees, management income and carry are earned.3,39
Management alignment is also relevant. RNS disclosures show a non-convertible personal loan facility from the CEO of up to £3m, with £500k initially drawn, and earlier director loans supporting the InEnTec opportunity payment.2,7 Salary-for-warrants / options alignment should be read in that context: it supports the view that senior insiders are economically exposed to successful value creation alongside shareholders.2
Section hook and takeaway: Repeatability is the route from single-project value to platform value. HUI is engaging with the relevant bodies, counterparties and stakeholders needed to test whether one successful KSA-style proof case can progress along the repeat-project / platform continuum. The takeaway is that inbound enquiries matter most after one bankable template works: if feedstock, integration, offtake, certificate capture, funding, fee stack and protected carry can be repeated, and if the same offtake / certificate-pricing route is repeatable across multiple SPVs, HUI can move from pre-revenue project creator toward repeatable SPV economics.
Section hook: Repeatability is where HUI can move beyond a single-project story. This section shows why inbound enquiry and a first proven KSA-style template could make 2–3 projects the first platform test, 5 projects a regional rollout case and a 10-project platform reference case a useful modelling illustration. The detail keeps the upside staged but makes clear that platform value should sit above the first-project certificate range if economics repeat.
Management indicates that inbound enquiry levels are strong, making repeatability a live upside theme rather than a base-case assumption. The relevant question is now whether engagement with project bodies, potential counterparties, feedstock providers, offtakers, funders and strategic stakeholders can turn a first working proof case into a repeat-project continuum. The platform case should therefore remain staged: first prove the anchor project, then show that the same economics can repeat across additional SPVs.
Platform case
Project count
Interpretation
Valuation treatment
Disclosure gates
Early repeatability
2–3 projects
Evidence that the first KSA-style structure can repeat across a second site, modular rollout or adjacent SPV.
Early repeatability becomes visible if at least one additional project repeats the KSA-style fee / carry and certificate architecture on attributable terms.
Repeat SPV terms, feedstock access, offtake route, funding plan and HUI-attributable fee/carry economics.
Regional rollout upside
5 projects
Evidence of a Saudi / GCC rollout model rather than a single flagship project.
Regional rollout upside if the same fee-stack, intended carry structure and certificate-sensitive economics repeat across several funded SPVs.
Partner-backed rollout plan, repeat funding route, project pipeline, technology-capacity plan and disclosed economics.
10-project platform reference case
10 projects
Strategic platform case in which HUI becomes a repeat project-originator across KSA, GCC and potentially UK-linked SAF channels.
10-project platform illustration. Because the 100% single-KSA certificate pass-through case is already c.£274m–£308m / c.49p–55p price target range before UK or platform value is included, a true multi-project platform case should sit at multiples above that range once repeat SPV economics are proven.
Multiple funded SPVs, scalable feedstock and offtake network, repeatable net fees, protected carry and project-finance evidence.
The arithmetic read-through is important even before repeat projects are fully valued. A single KSA-style project now contains several potentially valuable layers: pre-revenue fees, the revenue-linked 2.5% operating-management fee, intended 20% carry participation and possible certificate-sensitive upside. Repeating part of that economic stack across 2–3 projects could be value-relevant; a five-project rollout would move the story toward regional platform value; and a 10-project case should be treated as a platform reference illustration, not a cap on ultimate ambition.
Section hook and takeaway: The valuation model is a roadmap, not a single-point target. The Single KSA Anchor-Project Sensitivity shows first-project fee/carry/certificate economics; the Milestone Valuation Range shows what becomes supportable as disclosure improves. The takeaway is that re-rating should be attached to milestones — paid work, funded FEED, documented SPV rights, eligible offtake, certificate capture and repeatability — rather than to project ambition alone.
Detailed roadmap material belongs in the valuation appendix; the main body keeps the reader focused on which evidence unlocks which valuation layer.
UK relevance to valuation: KSA remains the core anchor, while the UK is the likely second territory / policy-backed platform option. Full UK DCF credit should wait for scale, capex, site, feedstock, offtake and SPV economics; Appendix D1 provides the UK-policy and funding-mechanism support.
Formal documentation / milestone-confirmation sensitivities: management clarification has materially reduced earlier uncertainty. HUI has indicated that the InEnTec licences are not open-ended obligations, that the explicit working assumption is US$500k per project licence cost, that HUI can receive plc-level fees from project / SPV structures, that the KSA and UK gate-fee assumptions are net figures, that SAF certification is advanced, that offtake discussions are encouraging on price, and that the LCFF application route is live. These points improve the evidence base; the remaining issue is formal proof through disclosed contracts, eligibility evidence, funding milestones and SPV documentation.
Formal confirmation still required: definitive licence / site-right documentation confirming no additional open-ended InEnTec obligations beyond disclosed or management-indicated project licence economics; final fee contracts and recipient entities confirming plc-level or group-level payment routes from SPVs / projects; SPV documents confirming 20% carry participation from first project revenue / distributable cashflow and during repayment periods; tax, withholding and net-remittance mechanics; confirmation that KSA c.US$50/t and UK c.£100/t gate-fee assumptions are net of sorting, clean-up, aggregation and transport; Hydrogen Systems / EPC / O&M role and guarantees; downstream licensor and process-guarantee structure; SAF certification and CORSIA / lifecycle treatment, including treatment of plastic-derived feedstock if rules evolve; binding offtake pricing and certificate-value capture; LCFF / grant / RCM milestone evidence where applicable, including that the correct UK support route is being pursued under scheme-specific eligibility rules; latest raise warrants, use of proceeds and loan repayment treatment.
Section hook: The valuation is best read as milestones, not a single false-precision target. This section shows what becomes supportable as evidence moves from option value to paid FEED, KSA fee/carry economics, certificate capture and repeatable platform delivery. The table is the staged re-rating map that ties the note’s evidence back to p/share outcomes.
A single target price would create false precision. The better approach is a staged valuation range that moves as evidence improves. The current market largely prices HUI as an option. The next re-rating requires proof that the KSA opportunity produces net HUI economics rather than only project-scale headlines.
Fee DCF interpretation: management clarification moves fees from a conservative side sensitivity to a central valuation layer. The relevant stack includes upfront licence-access fees, development and FEED-stage economics, EPC-related economics, project-management or success fees, recurring operating-management fees and technical-assistance income.
For modelling, the fee stack should be split into pre-revenue fees, the 2.5% revenue-linked operating-management fee and the separate 20% carry. Pre-revenue fees support runway, the operating-management fee creates recurring revenue once the plant operates, and carry provides project upside if protected in SPV documents.
Fee layer
Expected timing
Indicative economics
Valuation relevance
Licence-access fee
Project initiation / pre-FEED
c.US$1m upfront per project, separate from the underlying InEnTec site licence cost.
Early monetisation of HUI’s licence, origination and project-creation position.
Development / FEED / EPC economics
Development, FEED and EPC procurement phase
Management answers indicate at least 1%–2% of relevant capex, illustrated as c.US$2m–US$4m per project.
Converts development work and project assembly into cash receipts before operations.
Project-management / success fee
Financial close, FID or delivery milestones
Expected c.US$1m–US$2m, subject to negotiation and final documentation.
Event-driven cash value that could materially reduce near-term dilution.
Operating management fee
Operations
Annual recurring fee linked to project revenue; management answer indicates 2.5% of revenue.
Creates a recurring revenue-linked fee layer once the project generates revenue; separate from pre-revenue fees and separate from carry distributions.
Technical-assistance / owner-support income
FEED, commissioning and operations
Scope-dependent; may include technical review, secondments, maintenance support, best-practice sharing, systems and central support.
Turns HUI’s technical and platform co-ordination role into a repeatable project-service revenue stream where contracted.
20% carry participation
Operations / distributions
Separate from fees and addressed in the carry section.
Separate project-participation upside. Carry is not a fee and should be analysed independently in the carry / waterfall section.
Repeatability
Each new project / site / territory where economics repeat
Separate fee streams may arise across KSA, UK, Oman, UAE, Fortress Fuel or future licensed projects.
Transforms fees from a single-project bridge into a platform valuation layer.
Fee-stack read-through: the table shows why HUI’s economics should not be collapsed into a single annual fee assumption. Fees can create pre-revenue cash receipts, the 2.5% operating-management fee creates a recurring revenue-linked layer, and the 20% carry remains separate SPV upside.
Updated Fee DCF interpretation: the single-project fee DCF uses the disclosed KSA revenue range, a 2.5% revenue-linked operating-management fee, a 30-year operating life, a two-year development/construction period, first-year 50% ramp-up and a 12% HUI discount rate. It deliberately keeps pre-revenue fees, recurring management income and carry separate: fees can support HUI before operations, the management fee scales with revenue once the plant operates, and carry drives upside if protected in the SPV waterfall.
Revenue case
Annual project revenue
2.5% operating-management fee
PV at 12% over 30-year operating life*
Low
US$105m
US$2.625m pa
c.US$15.9m
Base
US$130m
US$3.250m pa
c.US$19.7m
High
US$155m
US$3.875m pa
c.US$23.5m
Declared / indicated pre-operating fee layer
Low
Base
25% capture: HUI 20% carry exposure c.US$12.5m pa; illustrative certificate PV c.US$76m.a,b,c
Timing assumption
Licence-access fee
US$1.0m
US$1.0m
US$1.0m
Project initiation / Year 1
Development / FEED / EPC economics
US$2.0m
US$3.0m
US$4.0m
Development / FEED / Year 1–2
Project-management / success fee
US$1.0m
US$1.5m
US$2.0m
FID / financial close / Year 2 assumption
Undiscounted pre-operating fee total
US$4.0m
US$5.5m
US$7.0m
Before operations
Illustrative PV at 12%
c.US$3.3m
c.US$4.5m
c.US$5.7m
Discounted to present value
Documentation discipline: the remaining modelling questions — recipient entity, fee seniority, payer, tax, withholding, third-party pass-throughs, net remittance and repeatability across later projects — are now documentation sensitivities rather than open-thesis questions. The main-body conclusion is that the fee stack is a central valuation layer if contracted, net retained and repeatable; detailed sensitivities are handled in Documentation Sensitivities, Risks and Appendix D.
Section hook and takeaway: The upside case and risk checklist are two sides of the same evidence test. HUI does not need first fuel for the market to re-rate, but it does need proof that it is paid for development work, keeps attributable economics, secures eligible offtake/certification and can repeat the model. The takeaway is that the next disclosures should be judged by whether they convert strategic relevance into cash receipts, funded engineering, protected SPV rights and repeatable HUI-level economics.
This section therefore functions as the bridge into Risks, Checklist and Conclusion: the same disclosures that reduce risk are the disclosures that make higher valuation ranges supportable.33
For the purposes of this note, peers are used as valuation lenses rather than direct comparables. HUI currently sits between categories: it is best read as an originator / project-manager / fee-and-carry hybrid, not yet a mature SAF producer, pure technology licensor, royalty company or infrastructure developer. The more important point is whether investors buy into the progress and scaffolding as HUI moves from pre-revenue project creator toward a potentially multi-project platform in short order. Appendix E sets out the peer-type detail, pipeline hierarchy and valuation-lens framework.
Section hook and takeaway: The risk section is the disclosure discipline for the whole note. The evidence base has improved, so the remaining question is not whether the story is interesting but what must be documented to turn project potential into HUI shareholder value. The takeaway is that attribution, dilution, commercialisation, feedstock, finance, integration/certification and timing must reduce together; no single announcement should be treated as solving the whole thesis.
The risk table below therefore focuses on one question: what evidence converts project-level potential into HUI-level value? The main tests are attribution, dilution, commercialisation, feedstock, finance, integration / certification and timing.
Risk
Why it matters
What reduces it
Attribution
Project value may not equal HUI shareholder value.
Disclosed pre-revenue fees, 2.5% operating-management terms, SPV rights, carry protection and waterfall terms.
Funding / dilution
Repeated equity could erode per-share upside.
Paid licence-access, development / FEED / EPC fees, success fees, project-level funding and strategic capital.
Commercialisation
MoUs may not become contracts.
Mandates, binding feedstock/offtake terms and funded work programmes.
Feedstock
Waste volume10,32, composition and gate-fee economics10 drive margins.
Bankable supply agreements and clear net/gross gate-fee treatment.
Integration / certification
TRL9 PEM22,30 does not prove full SAF plant bankability.
FEED, EPC/O&M wrapper, certification route and offtake acceptance.
Timing
Revenues and distributions may arrive later than market hopes.
Clear milestone reporting: funded FEED, FID, construction, first fuel.33
The table should be read as a prioritised diligence list rather than a new set of thesis questions. Value creation depends on several risks reducing together, not on any single announcement in isolation.
Section hook and takeaway: The conclusion brings the evidence circles back to valuation. HUI is still being priced like optionality, but the evidence base now includes KSA economics, UK licence progress, certificate-pricing upside, fee/carry architecture, IO / partner validation and repeatability potential. The takeaway is that HUI does not need every ambition to land at once; it needs enough documented milestones to prove that a waste-to-SAF originator can become a fee, management-income and carry platform.
HUI is now best read as an evidence-led waste-to-fuels platform rather than a generic hydrogen concept. KSA provides the anchor project.10 The UK licence adds a policy-backed second territory.39 Certificate economics create material single-project upside only if eligibility and project-level capture are documented, but the UK mandate buy-out mechanism now makes the buyer-avoidance economics visible rather than theoretical.17,33,49 IO and partner evidence is beginning to build the bankability bridge.48
The financial case is more defined than the current market value implies. HUI may capture licence-access, development and management fees, a 2.5% revenue-linked operating-management fee and intended 20% carry participation.10,33 The US$500k UK InEnTec licence provides a repeat-project licence-cost marker.39 Certificate-sensitive KSA upside remains conditional on eligibility, offtake and SPV capture, but the UK SAF Mandate / buy-out framework now provides a visible buyer-compliance architecture behind that pricing sensitivity.17,33,49 The UK platform route remains subject to LCFF / RCM eligibility, site, offtake and SPV documentation; where awarded, a 15-year RCM contract could support bankability for roughly half of the 30-year operating-life framework used in this note.40,41
The valuation hierarchy is now clear: the conservative prior framework has been overtaken by the evidence-led KSA bridge. The core KSA fee + carry case before certificates is c.9p–15p. Single-KSA certificate sensitivities rise to c.19p–26p at 25% capture, c.29p–36p at 50% capture and c.49p–55p at 100% pass-through. Multi-project platform upside should sit above the single-project certificate range, but only once repeat SPV economics, feedstock, offtake, funding, fee stack and protected carry terms are documented.
The re-rating path is therefore evidence-led. Paid or funded work would support the fee layer.33 Protected carry would support the distribution layer.33 Eligible certificate-priced offtake would support the KSA certificate layer.17,20 Repeat licence/site-right economics and repeat SPV terms would support the platform layer.39
The checklist below turns the upside case into a practical disclosure tracker. Each item should be judged by whether it converts strategic relevance into attributable HUI economics: cash receipts, funded engineering, protected SPV rights, bankable feedstock, eligible offtake/certification evidence and a credible project-finance pathway.10,33
Disclosure
Why it matters
Paid mandate / funded FEED
Shows HUI can monetise its role before construction / first revenue and reduces dilution risk.
SPV economics
Clarifies pre-revenue fees, 2.5% operating-management fee mechanics, carry, waterfall and whether project value is attributable to shareholders.
Feedstock contract
Confirms volume, gate fee and net/gross economics.
SAF certification / offtake route
Moves revenue from theoretical to financeable.
EPC/O&M / strategic partner role
Reduces engineering, integration and lender-diligence risk.
Project-finance terms
Determines dilution, capital burden, repayment-period mechanics and timing of HUI distributions.
Appendices A–F provide supporting detail for the main note: assumptions, cost-stack logic, technology-scale evidence, DCF derivations, fee/carry sensitivities, pipeline/peer framing and valuation scenarios. Any remaining unresolved points should be read as documentation or disclosure sensitivities rather than as live management-question placeholders.
Appendix A supports the main note’s cost-advantage and competitiveness claims. It is included to show how the later KSA RNS assumptions translate into revenue, EBITDA, implied revenue per barrel and potential pricing headroom versus premium SAF indications. This appendix should be retained even if Appendix H is removed, because it provides supporting detail for the KSA operating model.
Input / calculation
Working value
Read-through
Feedstock
200k–250k tpa
Core KSA RNS assumption.
Gate fee
c.US$50/t
Management indication is that this is a net gate-fee assumption; formal feedstock contracts should still confirm net treatment, sorting / clean-up / aggregation / transport costs and payer economics.
Power
c.US$0.06/kWh
Central to KSA cost advantage.
OPEX
c.US$35m pa
Base operating cost in RNS model.
Revenue
US$105m–US$155m
Dominant financial source remains later RNS model.
SAF output
400k–600k bbl pa
Used to derive implied revenue per barrel.
Implied revenue / barrel
c.US$175–388/bbl; midpoint c.US$260/bbl
Suggests model does not depend on extreme spot SAF premiums.
Operating-model derivation: the RNS range of US$105m–US$155m revenue and c.US$35m opex implies c.US$70m–US$120m EBITDA after normalisation. The base case used in the note is US$130m revenue, US$35m opex and c.US$95m EBITDA. The 20% headline attribution is therefore c.US$19m EBITDA before capex, tax, financing, waterfall and timing adjustments.
Case
Revenue
OPEX
EBITDA
Project FCF before financing
Low
US$105m
(US$35m)
US$70m
US$62m after sustaining-capex buffer
Base
US$130m
(US$35m)
US$95m
US$83m after sustaining-capex buffer
High
US$155m
(US$35m)
US$120m
US$105m after sustaining-capex buffer
Why the appendix matters: the implied revenue per barrel of c.US$175–388/bbl, with a midpoint around c.US$260/bbl, supports the main-body claim that the model is not dependent on extreme spot SAF premiums. The cost-stack advantage instead comes from a combination of gate-fee economics, low-cost KSA power, scale, high-value liquid fuel, and possible co-product revenue. FEED and offtake still need to confirm the product mix and realised buyer price.
Operating cost per barrel: the table below derives the simple operating production-cost range used in the main body. It is not a full levelised cost of SAF, because it excludes project financing, tax, ramp-up, carbon handling and final offtake terms. It also does not deduct gate-fee income a second time: management indication is that gate-fee economics are already reflected in the RNS operating model.
Cost metric
Formula
Result
OPEX / barrel — low output
US$35m / 400k bbl
US$87.50/bbl
OPEX / barrel — midpoint
US$35m / 500k bbl
US$70.00/bbl
OPEX / barrel — high output
US$35m / 600k bbl
US$58.33/bbl
Unit-conversion basis for SAF / fuel comparisons: To make the cost comparison readable across barrel, gallon, litre and tonne references, this note uses 1 barrel = 42 US gallons, 1 barrel ≈ 159 litres, indicative jet-fuel / SAF density of c.0.8kg/litre, 1 barrel ≈ 127kg, 1 tonne ≈ 7.9 barrels, 1 tonne ≈ 331 US gallons and 1 tonne ≈ 1,250 litres. These conversions are model-derived and used for comparability rather than as chemical-specification inputs.33
Pathway / reference
Technology definition
Cost / price basis
Read-through for HUI
HUI KSA waste-to-SAF
Residual waste / plastics to syngas through InEnTec PEM, then downstream FT / upgrading route.
Operating cost c.US$58–88/bbl based on the RNS c.US$35m opex range and 400k–600k bbl output range. Gate-fee economics are treated as part of that operating model rather than deducted again.
Potential cost-base advantage if feedstock, gate fee, power, yields and offtake are validated.
HEFA SAF
Hydroprocessed esters and fatty acids; mature route using used cooking oil, fats and similar feedstocks.
Dominant today but feedstock-constrained and subject to policy/availability limits.20,21
Supports need for advanced / waste-derived routes if SAF demand expands beyond scarce oil-and-fat feedstocks.
FT-SAF / advanced waste-derived SAF
Syngas-to-liquids route using Fischer-Tropsch synthesis and upgrading into jet-range products.
Published production-cost reference c.US$2,200–3,200/t, or c.US$920–1,340/bbl equivalent.27
HUI is targeting this broad logic, but claims lower operating-cost potential through its KSA waste/gate-fee/power stack.
e-SAF / power-to-liquid
CO₂ plus green hydrogen converted into synthetic fuel; highly decarbonised but hydrogen- and power-intensive.
Useful as hydrogen-intensity benchmark: c.0.52kg H₂/kg finished product in FCA report.29
Reinforces why low-cost hydrogen / syngas and cheap power matter to long-run SAF economics.
Appendix C now contains the certificate sensitivity matrices and DCF support. The main-body conclusion is that certificate value sits outside the KSA physical-fuel base case and becomes material through eligible offtake / certificate-priced capture; the Single KSA Anchor-Project Sensitivity remains the controlling main-body exhibit.
Appendix C also retains the certificate DCF support. The Single KSA Anchor-Project Sensitivity is the controlling exhibit in the main body: 25% capture is the current 12–18 month focus, 50% is a stronger offtake-supported upside case, and 100% pass-through remains the top single-project certificate milestone.
Appendix B supports the main note’s technology-scale and integration-risk claims. It is included because the KSA model depends on whether the physical unit arithmetic reconciles with the RNS feedstock and SAF-output assumptions. The appendix does not prove bankability; it shows why the scale is coherent enough to model and what FEED must still validate.
Scale item
Figure
Implication
InEnTec Unit / PEM module
125 tpd
Presentation unit assumption.
Operating days
360 days pa
125 tpd × 360 = 45,000 tpa per unit.
Five-unit configuration
c.225,000 tpa
Broadly matches KSA RNS 200k–250k tpa feedstock range.
Hydrogen per unit
c.24 tpd / c.8,000 tpa
Assumes water-gas shift.
Five-unit hydrogen output
c.40,000 tpa
Directionally consistent with c.600k bbl synthetic-fuel scale.
Commercial reference scale
Columbia Ridge / Dow Corning cited at 25 tpd
KSA case requires scale-up to 125 tpd units and multi-unit integration.
KSA plastics waste
c.4.0m tpa / c.88 units
Supports modular repeatability scale.
KSA used tyres
c.600k tpa / c.14 units
Supports additional waste-stream optionality.
KSA medical waste
c.100k tpa / c.3 units
Supports broader circular-economy use case.
Step
What it measures
Main numerical output
Where derived
1. RNS steady-state EBITDA
Operating case before capex, tax, debt service, timing and distributions.
Base project EBITDA c.US$95m; HUI 20% attributable EBITDA c.US$19m10.
RNS-Guided Assumption Stack; Appendix D.
2. Full project DCF
Whole-project value after US$800m capex, delayed revenue and first-year ramp-up.
Base case project NPV negative in Year 3–5 revenue-start scenarios; high case only works materially in faster timing33.
Appendix D.
3. HUI free-carry DCF
Value of HUI’s 20% carry if genuinely free-carried, protected and distributable.
Base 20% carry DCF ranges roughly US$52m–US$88m depending on revenue start and shareholder-loan treatment33.
Appendix D and the HUI Economic Capture section.
4. Fee DCF layer
Potential licence-access, development / FEED / EPC, success-fee, recurring operating-management and technical-assistance income before or alongside distributions.
Updated fee-stack DCF indicates a single-project gross fee PV of c.US$19m–US$29m before separately quantified technical-assistance income, with legacy US$1m–US$2m short-duration cases retained only as downside / floor-testing reference.
HUI Economic Capture: Updated Fee Architecture and Illustrative Updated Fee DCF; requires confirmation of amount, payer, recipient entity, timing, seniority, tax, withholding and InEnTec pass-through.
5. Multiple-fee sensitivity
What the broader fee stack could mean before or alongside plant revenue, without implying carry waits for later distributions.
One-off success / financial-close fees of US$3m–US$5m would be additive and could materially reduce near-term dilution if paid before first revenue or alongside project financing.
Fee DCF section and management clarification checklist.
6. Repeatability portfolio
Low-probability value from second KSA project, industrial hydrogen, Oman, UAE, UK, PHE/Mithras and Fortress Fuel.
Probability-weighted uplift only; not full DCF credit.
Risk-Weighted Repeatability Portfolio; Appendix F and Appendix G support.
7. Milestone valuation range
How equity value might move as evidence improves.
Indicative ranges from current option value to paid FEED, protected KSA economics, FID and repeatability platform.
Milestone-Based Valuation Range.
Scale methodology: HUI KSA presentation material assumes each InEnTec Unit / PEM module processes 125 tonnes per day for 360 operating days. That produces c.45,000 tonnes per annum per unit. Five units therefore produce c.225,000 tonnes per annum of processing capacity, matching the later KSA RNS feedstock range of 200,000–250,000 tonnes per annum.
Hydrogen-to-SAF cross-check: the same presentation material indicates c.24 tonnes hydrogen per day, or c.8,000 tonnes per annum, per unit assuming water-gas shift. Five units therefore imply c.40,000 tonnes hydrogen per annum. External synthetic-fuel benchmarks of c.60–70kg hydrogen per barrel imply c.36,000–42,000 tonnes hydrogen per annum for 600,000 barrels of synthetic fuel / SAF. The directional match supports the physical scale logic but does not replace FEED.
Integration-risk conclusion: Columbia Ridge and Dow Corning are cited as 25 tpd commercial-scale references, while the KSA case assumes 125 tpd units and multi-unit integration. The key diligence question is therefore scale-up and integration: syngas yield, H₂/CO ratio, water-gas shift, Fischer-Tropsch conversion, upgrading, utilities, uptime, certification and offtake.
Appendix C is the principal numerical derivation for the main note. It is included so the reader can see why the RNS steady-state EBITDA should not be treated as immediate HUI shareholder value. The appendix separates whole-project DCF after US$800m capex from HUI’s carry/distribution DCF, and shows how timing and shareholder-loan treatment change value.
DCF methodology: the project model uses a 30-year period, no terminal value, a 10% project discount rate, a 12% HUI distribution discount rate, US$800m capex split US$400m in Year 1 and US$400m in Year 2, 50% ramp-up in the first revenue year, and full operating cash flow thereafter. The point is not to produce a false-precision project target; it is to show how much capex and timing reduce the apparent value of the headline EBITDA.
Matrix basis: the certificate matrices use 500k bbl pa as the midpoint of HUI’s disclosed 400k–600k bbl KSA SAF output range, US$500/bbl certificate-equivalent value, 30-year operating life and a first-year 50% ramp-up. Rows show eligible export / certificate-priced output share; columns show certificate capture as a percentage of US$500/bbl. The matrices are incremental to the physical-fuel base case and do not change any main-body valuation numbers.
Matrix 1: annual project certificate revenue uplift (US$m pa)
Eligible / certificate-priced output share
25% capture
50% capture
75% capture
100% capture
25%
15.6
31.3
46.9
62.5
50%
31.3
62.5
93.8
125.0
75%
46.9
93.8
140.6
187.5
100%
62.5
125.0
187.5
250.0
Matrix 2: project certificate DCF uplift at 10% project discount rate (US$m)
Eligible / certificate-priced output share
25% capture
50% capture
75% capture
100% capture
25%
140
280
421
561
50%
280
561
841
1,122
75%
421
841
1,262
1,682
100%
561
1,122
1,682
2,243
Matrix 3: HUI 20% carry / distribution PV at 12% HUI discount rate (US$m)
Eligible / certificate-priced output share
25% capture
50% capture
75% capture
100% capture
25%
18.9
37.9
56.8
75.8
50%
37.9
75.8
113.6
151.5
75%
56.8
113.6
170.4
227.3
100%
75.8
151.5
227.3
303.0
Read-through: the 19p–26p case represents an effective 25% certificate-value case and can be reached through multiple combinations of eligible volume and certificate capture. For example, 100% eligible output at 25% capture and 50% eligible output at 50% capture both generate US$62.5m pa of annual project certificate revenue uplift and c.US$75.8m HUI certificate carry PV on the 12% HUI distribution basis. If certificate value is captured as realised project revenue, HUI’s 2.5% operating-management fee may also scale with the higher revenue base, subject to final fee definition; this incremental fee effect is not included in the certificate carry matrix unless separately stated.
Mandate pricing bridge: the certificate-uplift matrices above are not intended to be speculative pricing. They use US$500/bbl as a modelling proxy for mandate-informed offtake pricing, not a guaranteed receipt. The conversion table below uses the document FX reference of US$1.3640/£ and 159 litres per barrel. On that basis, US$500/bbl is c.£367/bbl, or c.£2.31/litre. That sits materially below the UK main-obligation buy-out level of £4.70/litre and the PtL buy-out level of £5.00/litre, which explain why scarce eligible SAF can have buyer-avoidance value for obligated suppliers.49
Pricing reference
US$/bbl or reference
£/litre equivalent / interpretation
HUI KSA physical-fuel proxy
c.US$260/bbl midpoint
c.£1.20/litre; physical-fuel base revenue proxy before certificate-equivalent uplift.
HUI certificate-equivalent modelling proxy
US$500/bbl
c.£2.31/litre; used as mandate-informed offtake-pricing sensitivity, not guaranteed revenue.
HUI fully bundled reference
c.US$760/bbl
c.£3.50/litre; physical-fuel proxy plus full US$500/bbl certificate-equivalent proxy before leakage, sharing, eligibility and SPV terms.
UK main-obligation buy-out reference
c.US$1,019/bbl
£4.70/litre statutory buy-out reference; compliance-cost ceiling, not HUI revenue.49
UK PtL buy-out reference
Higher PtL reference
£5.00/litre PtL buy-out reference; relevant to PtL sub-obligation, not the KSA base case.49
Buyer-incentive read-through: if an obligated fuel supplier cannot secure eligible SAF certificates, the economic alternative may be to buy conventional jet fuel and pay the buy-out. The main-obligation buy-out alone is c.US$1,019/bbl at the document FX rate, before the cost of the alternative fuel. That creates powerful behavioural dynamics: a supplier paying HUI/SPV a certificate-priced fuel package below the buy-out-plus-fuel alternative is not simply overpaying for SAF; it may be reducing its compliance cost while giving HUI/SPV room to capture mandate-driven scarcity value through the realised wholesale/offtake price, subject to eligibility, lifecycle treatment, delivery mechanics and contract terms.49
Distribution-timing sensitivity: the Project NPV and HUI 20% carry DCF tables use Year 3, Year 4 and Year 5 revenue-start cases to show how delay affects value. Year 3 aligns with intended early revenue / distribution participation, while Year 4 and Year 5 show the valuation cost if project revenue or distributable cashflow starts later.
Project NPV, HUI carry and steady-state funding-rate sensitivity
Project NPV and HUI 20% carry sensitivity
Case
Revenue
EBITDA
Project FCF before financing
Year 3 Project NPV
Year 4 Project NPV
Year 5 Project NPV
Low
US$105m
US$70m
US$62m
(US$241m)
(US$285m)
(US$326m)
Base
US$130m
US$95m
US$83m
(US$87m)
(US$147m)
(US$201m)
High
US$155m
US$120m
US$105m
US$74m
(US$1m)
(US$70m)
HUI carry case
Year 3 start
Year 4 start
Year 5 start
Intended early-distribution base case
US$88m
US$77m
US$67m
Downside loan-sweep / delayed-distribution sensitivity
US$66m
US$59m
US$52m
The Project NPV table above is a conservative no-terminal stress test after full capex. The steady-state comparison below is a capital-provider lens: it capitalises the same Low/Base/High project FCF at different discount rates to show how strategic, sovereign-linked or lower-cost project capital may value the operating asset differently. It is not intended to replicate AFC’s 5-year DCF plus terminal-value model, because that would require matching AFC’s assumptions on capex treatment, explicit-period growth, terminal value, WACC, FX and whether the output is project enterprise value or net value after funding.
Project FCF case
12%
10%
8%
6%
Low — US$62m project FCF
US$517m
US$620m
US$775m
US$1,033m
Base — US$83m project FCF
US$692m
US$830m
US$1,038m
US$1,383m
High — US$105m project FCF
US$875m
US$1,050m
US$1,313m
US$1,750m
This comparison applies a five-year explicit DCF plus terminal value after US$400m capex in Year 1 and US$400m in Year 2, with operating cashflow beginning in Year 3. It differs from the steady-state table above because it includes the build-period capex and explicit timing before applying a terminal value, rather than simply capitalising mature steady-state FCF.
Project FCF case
12%
10%
8%
6%
Low — US$62m project FCF
(US$155m)
(US$68m)
US$46m
US$196m
Base — US$83m project FCF
US$15m
US$106m
US$224m
US$380m
High — US$105m project FCF
US$194m
US$288m
US$411m
US$573m
The table is included to show methodology rather than to change the central valuation. It helps reconcile why a project-finance / capital-provider lens can produce a materially different project value from the no-terminal stress test, while HUI’s central valuation remains based on fees, 2.5% operating-management income and 20% carry / distribution rights rather than ownership of 100% of the mature project asset.
Interpretation: Appendix C deliberately shows three different lenses. First, the no-terminal project DCF is a conservative full-capex stress test, showing how tough the physical-fuel project can look before certificates, grants, RCM, lower-cost capital or terminal value. Second, the steady-state and 5-year DCF + terminal-value tables show how project-finance, strategic or lower-cost capital providers may value the same Low/Base/High cashflows differently. Third, the HUI valuation remains separate: HUI is valued through licence-access fees, development / FEED income, the 2.5% operating-management fee and 20% carry / distribution rights, not as owner of 100% of the mature project asset. Certificate economics sit on top of the physical-fuel base case and are shown separately in the matrices above.
Appendix D supports the main note’s economic-capture argument. It explains how HUI may be paid through pre-revenue fees, the 2.5% revenue-linked operating-management fee, technical-assistance income and protected 20% carry participation, and why waterfall / distribution mechanics determine whether project economics become HUI shareholder value. The purpose is to separate fee income, management income, carry and SPV distributions rather than treating gross project value as directly attributable to HUI.
Economic channel
Illustrative basis
Read-through
Development / FEED fee
Amount, payer and seniority to be confirmed
Earliest proof that HUI is being paid for its role.
Management fee
Legacy US$1m–US$2m net annual fee sensitivity only
Prior downside / floor-testing reference; not the controlling fee case now that the broader fee stack and 2.5% revenue-linked operating-management fee are modelled separately.
Success / close fee
US$3m–US$5m placeholder if separately agreed
Potentially valuable if paid before distributions.
20% carry participation
Requires protection through SPV and funding
Valuable only if not diluted, subordinated or reset at project finance.
Legacy fee-sensitivity methodology: the US$1m–US$2m net annual fee sensitivities are retained as prior downside / floor-testing references only. They were useful before management clarification because they tested whether a narrow fee stream could support value, but they should not be read as the controlling case now that the fee architecture includes pre-revenue fees, a 2.5% revenue-linked operating-management fee, technical-assistance income and separate carry participation. One-off success or financial-close fees would be additive if separately agreed.
Waterfall methodology: fee income is most valuable if it is senior project-level opex or a standalone payment to HUI / HUI KSA before investor distributions, debt sweep or shareholder-loan repayment. It is less valuable if subordinated, deferred, rolled up, contingent on surplus cash, or partly passed through to InEnTec or other providers. Carry value is most valuable if HUI’s 20% participation is protected through financial close, recognised during repayment / distribution periods and not diluted or reset when strategic capital enters the SPV.
Repeatability layer
Current probability treatment
What would move it higher?
First KSA SAF
Core probability-weighted DCF anchor.
Funded FEED, SPV terms, feedstock contract, offtake term sheet.
Second KSA / medium-scale repeat
Low probability platform option.
Repeat mandate or partner-backed modular rollout.
Industrial hydrogen / steel-cement
Discounted adjacent option supported by heavy-industry hydrogen / steel-cement use cases.
End-user, project terms and HUI economics.
UK SAF platform
Licensed policy-backed option
Feedstock, site, LCFF, offtake, RCM eligibility
Oman / UAE
Early regional replication options
Funding and project economics
Fortress Fuel
Defence-security option
Procurement route and customer validation
Legacy Conservative Fee Sensitivity
Illustrative net annual HUI fee
3-year PV at 12%
5-year PV at 12%
8-year PV at 12%
Valuation comment
US$1m pa
US$2.4m
US$3.6m
US$5.0m
Prior downside / floor-testing reference only; useful runway support, but not the live fee-stack assumption.
US$2m pa
US$4.8m
US$7.2m
US$9.9m
Prior downside / floor-testing reference only; could reduce dilution risk but should not frame the updated fee architecture.
The table above should now be read only as the conservative prior case. It values a narrow US$1m–US$2m net annual fee stream under short-duration downside / floor-testing assumptions used before management clarification. It should not be read as the controlling fee case.
Item
KSA base
UK conceptual treatment
Output
400k–600k bbl pa
300k–500k bbl pa placeholder until scale disclosed
Gate fee
c.US$50/t net assumption
c.£100/t net assumption; £75–100/t sensitivity until contracts confirm net treatment
Power / land / utilities
Low-cost KSA advantage
Higher UK cost base
RNS revenue
US$105m–155m
Not yet disclosed
Certificates
Export-linked / offtake-pricing sensitivity outside base revenue; no direct UK RCM mechanism
Direct UK SAF Mandate / certificate context where eligible
RCM
KSA does not receive UK RCM directly. Keep RCM out of KSA base and certificate sensitivity; KSA can still realise mandate / certificate-equivalent pricing through eligible offtake if compliant and contractually captured.
Potentially available to UK project
Grants
Strategic capital / local funding
LCFF as the live / explored scheme-specific grant or development-support route; RTFO is legacy renewable-fuel architecture / policy history for SAF, with the SAF Mandate now the current certificate regime.40,42 Investment aid may be separate from operational certificate mechanisms and remains subject to scheme rules. National Wealth Fund is broader strategic-capital context only unless a specific HUI funding route or allocation is disclosed.43
Risk weight
Core anchor
Heavy discount today, but rising probability
KSA remains the DCF anchor, the UK is the licensed policy-backed option, and industrial hydrogen, PHE/Mithras, Oman, UAE and Fortress Fuel remain strategic options until project economics and HUI’s attributable entitlement are disclosed.
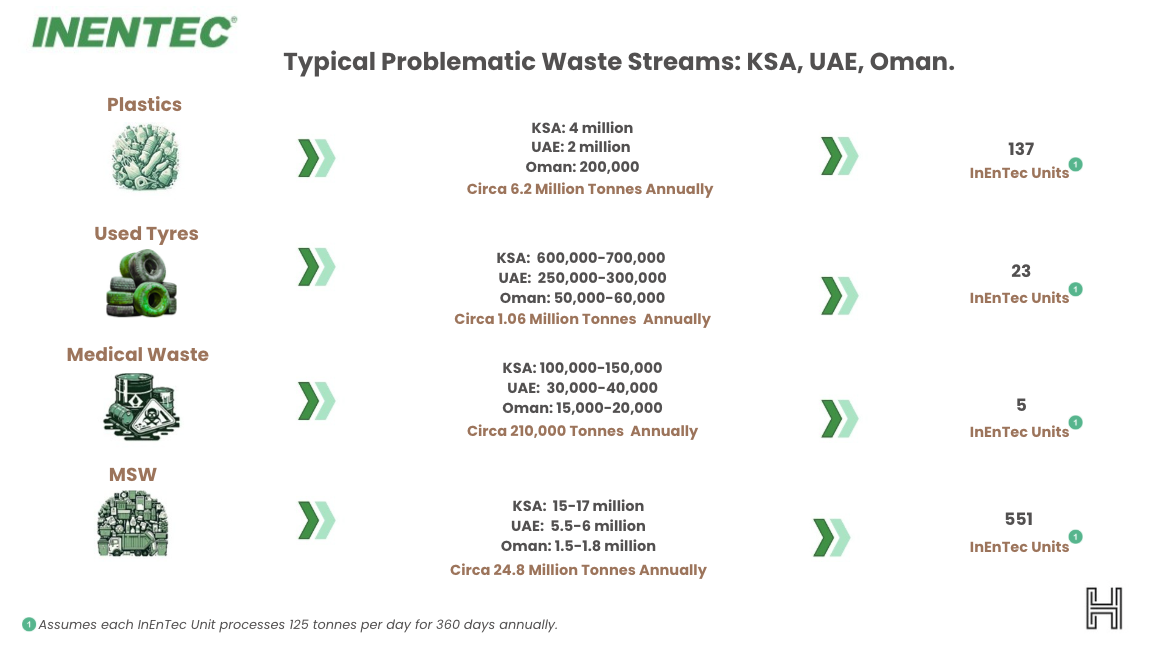
MENA waste opportunity supports the regional repeatability argument behind HUI’s MENA InEnTec licence.
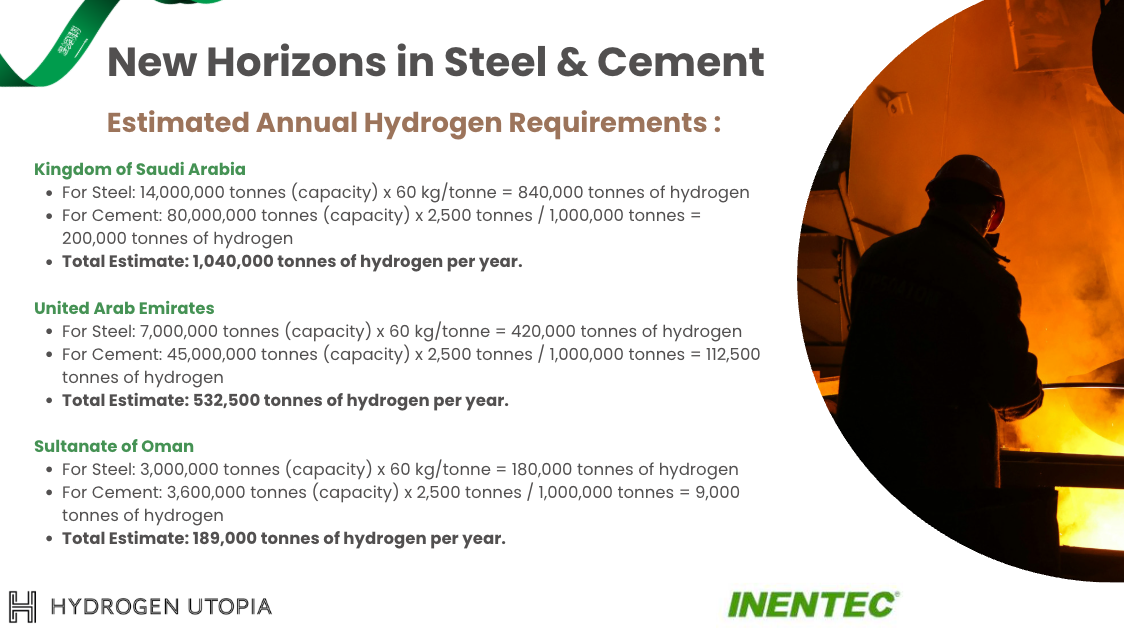
MENA steel and cement hydrogen demand supports the adjacent industrial-hydrogen and EPC/O&M growth option.
Appendix E provides supporting detail on the pipeline, peer-lens and Saudi SPV framework. It is included to make clear that HUI does not yet have a single direct peer. The appropriate valuation lens changes with the evidence stage: contracted fee income, protected carry, certified SAF/offtake, or repeatable development-platform economics.
Evidence HUI proves
Relevant lens
Valuation implication
Contracted development or management fees
Infrastructure developers
Fee-income multiple and reduced dilution risk.
Protected carry / promote
Carry / royalty-style models
PV of protected economic interest.
Certified SAF and bankable offtake
SAF / renewable-fuels developers
DCF and EV/EBITDA logic becomes more relevant.
Repeatable KSA / MENA platform
Development platforms
Platform premium if economics repeat.
Fortress Fuel public-RNS support table: the table below uses only public RNS disclosure and frames Fortress Fuel as a strategic option rather than a core DCF input.
Fortress Fuel item
Public RNS support
Valuation relevance
Product slate
JP-8 military aviation fuel, diesel and petrol / petrol-equivalent fuels.14
Creates a defence fuel-security vertical separate from the SAF commercial aviation thesis.
Output target
Up to 28,000 tonnes of JP-8 per year, equivalent to approximately 221,000 barrels annually, with diesel and petrol / petrol-equivalent output also referenced.14
Material option, but smaller than the KSA SAF anchor and not yet part of the core DCF.
Feedstock
Waste plastic, end-of-life tyres and stockpiled plastic feedstock.14
Links the same waste-to-syngas platform to fuel-security use cases.
Deployment logic
Distributed production at or near point of use, including forward bases and strategic installations.14
Addresses logistics-chain exposure and could carry a resilience / procurement premium if validated.
Autonomy / resilience
Designed to reduce reliance on external electricity and water infrastructure, subject to final configuration and operating conditions.14
Supports security-of-supply optionality, but requires technical and procurement validation.
Corporate structure
Fortress Fuel Limited created as a dedicated subsidiary.14
Distinct market, customer and procurement route from commercial SAF / KSA activities.
Customer status
Preliminary defence, security and strategic-infrastructure discussions, including meetings in Vilnius and Brussels with NATO; no certainty of commercial agreements.14
Option value only until procurement route, counterparties and economics are disclosed.
HUI economics
RNS describes project origination, structuring and development upside, but specific fees, equity or revenue participation are not yet disclosed.14
No core valuation credit until HUI-attributable economics are visible.
Pipeline methodology: KSA waste-to-SAF remains the core DCF anchor because it has the most complete public model. KSA industrial hydrogen, Oman, UAE, UK SAF, PHE/Mithras and Fortress Fuel remain probability-weighted options until binding project economics, HUI entitlement and funding terms are disclosed.
Peer methodology: peers are valuation-method references, not direct comparables. Contracted fees would make infrastructure-developer fee multiples more relevant; protected carry would make carry / royalty-style valuation more relevant; certified SAF and bankable offtake would make renewable-fuels DCF and EV/EBITDA logic more relevant; and repeatability would support a development-platform premium.
Evidence HUI proves
Illustrative reference names
Best valuation metric / lens
Why it matters for HUI
Contracted development / management fees
Infrastructure developers / project-development sponsors
Fee income multiple, EV/revenue or EV/EBITDA on contracted fees
Relevant only if HUI is paid before project distributions.
Protected carry / promote / carried equity
Royalty / streaming reference models such as Franco-Nevada and Wheaton Precious Metals34
NAV of carried interest, PV of distributions, royalty/carry multiple
Relevant if HUI retains protected economics without funding capex.
Certified SAF / bankable offtake
Neste, LanzaJet, Gevo and Velocys as SAF / renewable-fuels references35,36,37,38
Project DCF, EV/EBITDA, EV/capacity, offtake-backed valuation
Relevant if SAF certification and buyer terms move the project toward bankability.
Waste-to-fuels / gasification execution
Velocys and Air Products Teesside as technology / integration-risk reference points24,38
Project risk haircut, capex/Mtpa, execution-risk discount
Useful for understanding why first-of-kind integration risk must remain discounted.
Repeatable KSA / MENA platform
Infrastructure originators, strategic industrial developers and sovereign-backed platforms
Platform premium, sum-of-parts, probability-weighted pipeline
Relevant if HUI proves repeatable fees/carry across more than one SPV.
Numeric peer-reference note: the table below is included as valuation-lens support only. These companies are not direct HUI comparables today. HUI should not be valued as a mature producer, listed SAF developer, private SAF technology company or royalty / streaming business unless it proves the matching evidence stage. Market data should be refreshed before any formal peer-multiple valuation is used.
Reference
Why relevant
Known numeric reference
Metric / lens
HUI read-through
Neste
Mature renewable-fuels / SAF producer.
2025 revenue c.€19.0bn; comparable EBITDA c.€1.683bn; Renewable Products comparable EBITDA c.€764m; renewable-products sales c.4.1mt; capacity targeted at c.6.8mtpa by 2027.35
EV/EBITDA, EV/revenue, EV/capacity, segment EBITDA.
Only relevant after HUI has certified product, offtake and bankable project economics.
LanzaJet
Private SAF technology / deployment reference.
Announced US$47m of new capital and first close of an equity round at US$650m pre-money enterprise valuation.36
Private EV / project deployment / technology-platform reference.
Useful for SAF-technology scarcity value, but HUI still needs disclosed project economics and retained rights.
Gevo
Listed renewable-fuels / SAF developer.
2025 revenue / Adjusted EBITDA / current market-cap and EV to be refreshed from latest filings and market data.37
EV/revenue, cash burn, project pipeline value, development-stage premium/discount.
Useful only if HUI moves from concept to funded project-development platform.
Velocys
FT-SAF / waste-to-synthetic-fuels project-development reference.
US$40m growth capital in 2024 take-private / new private-company phase; historical market-cap / project-value metrics to be refreshed if used quantitatively.38
Technology / project-development funding reference; execution-risk comparator.
Supports the need for execution haircuts on FT-SAF / waste-to-fuels projects.
Franco-Nevada / Wheaton Precious Metals
Royalty / streaming reference for protected carry economics.
Current EV/EBITDA, dividend-yield and royalty/streaming multiples require market-data refresh before formal use.34
PV of carried interest, royalty/carry multiple, P/NAV style reference.
Relevant only if HUI proves a protected carry / promote that does not require funding capex.
Illustrative UK Industrial-Cluster Archetypes
The UK main body deliberately does not name preferred sites. The examples below are included only as industrial-cluster archetypes: brownfield locations with utilities, logistics, ports, pipelines, power, hydrogen / CO₂ planning or fuel-distribution infrastructure that illustrate the type of ecosystem a UK waste-to-SAF project would likely require. They are not presented as selected HUI sites or as evidence of site control.
Illustrative cluster archetype
Relevant public evidence
Why it matters for HUI
Teesside / Wilton
Wilton International describes a 2,000-acre multi-occupancy industrial site with private-wire power, power generation, 120km of pipelines and service corridors, utilities, industrial gases, feedstock/product movement and development plots; Teesside also sits within the East Coast Cluster / Net Zero Teesside carbon-capture and industrial-decarbonisation framework.46,47
Shows the type of brownfield process-industry ecosystem that could support utilities, logistics, industrial integration and grant / decarbonisation alignment.
Stanlow / HyNet corridor
Public material on Stanlow highlights an existing refinery and energy hub with low-carbon hydrogen, carbon capture, SAF plans, import infrastructure, jet-fuel blending and established aviation-fuel distribution routes.48,49
Illustrates how existing fuel, refining, storage, blending and distribution infrastructure can improve the practicality of SAF deployment and offtake logistics.
Saltend / Humber
Saltend Chemicals Park describes a 370-acre industrial site on the Humber with deepwater jetty access, world-class chemicals / renewable-energy businesses, Zero Carbon Humber participation, hydrogen and CO₂ infrastructure plans and SAF-related development activity.50,51
Demonstrates the value of locating within an existing chemicals / energy estuary where utilities, ports, hydrogen, CO₂ and industrial counterparties are already part of the regional plan.
Grangemouth
Scottish Enterprise and Scottish Government material describes Grangemouth as a strategic industrial cluster with port access, utilities, logistics, energy infrastructure, hydrogen / carbon-capture pathways and a formal just-transition / industrial-regeneration strategy.52,53
Shows why brownfield industrial-transition sites may attract policy support, planning focus and redevelopment capital if projects fit the local decarbonisation strategy.
Appendix F is retained as legacy valuation support / methodology record only. Earlier drafts used a 12p–15p risk-weighted framework and probability scenarios to rationalise the original market discount, but the main body now uses the Single KSA Anchor-Project Sensitivity and Milestone Valuation Range as the controlling valuation framework. The tables below preserve the prior workings and should not override the current main-body valuation hierarchy.
Scenario
Market cap
Probability
Weighted value
Optionality only
£10m
10%
£1.0m
Fee validation
£25m
25%
£6.3m
Subordinated / delayed carry
£40m
25%
£10.0m
Protected carry + senior fees
£75m
20%
£15.0m
Bankability / platform validation
£125m
10%
£12.5m
Multi-project platform
£250m
10%
£25.0m
Risk-weighted total
100%
~£70.5m
Scenario methodology: the risk-weighted table assigns increasing value to evidence stages: option value, fee validation, delayed/subordinated carry, protected carry plus senior fees, bankability/platform validation and multi-project platform value. The ~£70.5m blended outcome equates to c.14.8p on 475.1m current shares and c.12.6p on the ~556.0m known diluted share count, supporting the snapshot range of 12p–15p.
Why this appendix matters: it prevents double counting. The first KSA project, fee DCF, carry DCF and repeatability portfolio should not be added mechanically at full value; they are staged by evidence and probability.
Management background is included as contextual support only and is therefore presented as an exhibit rather than a core valuation appendix. Execution capability matters, but it does not substitute for disclosed project economics, protected HUI rights, bankable counterparty terms or evidence that HUI captures value from future SPVs.
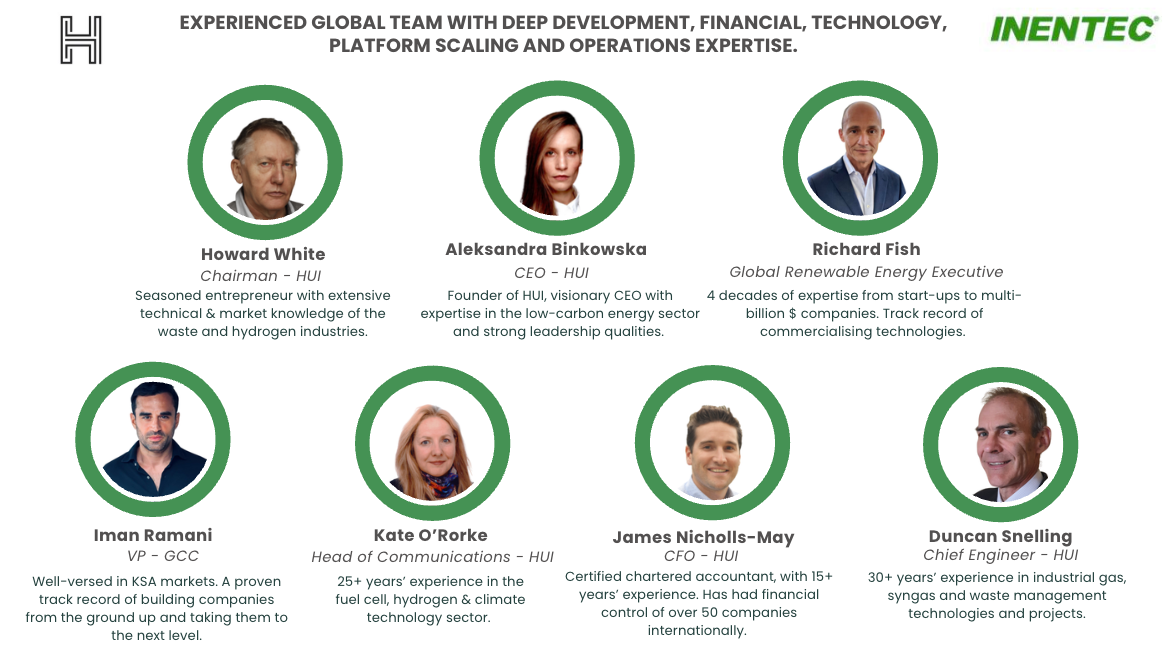
Management and adviser snapshot: execution background is relevant, but valuation still depends on disclosed project economics and HUI-attributable rights.
1. London Stock Exchange, Hydrogen Utopia International plc company page / market data, used for recent quoted share price, market-cap and selected share-count basis. https://www.londonstockexchange.com/stock/HUI/hydrogen-utopia-international-plc/company-page
2. Hydrogen Utopia International plc, Final Results for the year ended 31 December 2025, RNS, used for FY2025 cash, borrowings, options and financial-position data. https://www.londonstockexchange.com/news-article/HUI/final-results/17083535
3. Hydrogen Utopia International plc, Broker Appointment & Successful £850k Fundraise, RNS, 24 July 2026, used for £850k gross proceeds, 42.5m new shares at 2.0p and 475,135,273 post-admission shares. https://www.londonstockexchange.com/news-article/HUI/broker-appointment-successful-850k-fundraise/17703770
4. Hydrogen Utopia International plc, Proposed Acquisition of Helmond Holding Group Corp, RNS, 27 February 2024. https://www.londonstockexchange.com/news-article/HUI/proposed-acquisition-of-helmond-holding-group-corp/16351414
5. Hydrogen Utopia International plc, Final Results for the period ended 31 December 2023, RNS, used for Longford/PHE, Ireland grant, North Macedonia/Ohrid and 2023 project pipeline context. https://www.londonstockexchange.com/news-article/HUI/final-results/16448257
6. Hydrogen Utopia International plc, Refocus on Core Plastic-to-Hydrogen and GCC Growth / Ohrid Organics Update, RNS, 12 October 2025. https://www.londonstockexchange.com/news-article/HUI/refocus-on-core-plastic-to-hydrogen-and-gcc-growth/17274588
7. Hydrogen Utopia International plc, Proposed Access to InEnTec Plasma Technology in MENA, RNS, 5 June 2025. https://www.londonstockexchange.com/news-article/HUI/proposed-access-to-inentec-technology-in-mena/17072849
8. Hydrogen Utopia International plc, MENA Licenses — Binding Outline Agreement, RNS, 24 July 2025. https://www.londonstockexchange.com/news-article/HUI/mena-licenses-binding-outline-agreement/17151487
9. Hydrogen Utopia International plc, HUI Secures Exclusive InEnTec License for future large KSA Projects, RNS, 14 December 2025. https://www.londonstockexchange.com/news-article/HUI/hui-secures-exclusive-inentec-license/17372804
10. Hydrogen Utopia International plc, KSA Waste Plastics-to-SAF: Illustrative Model, RNS, 2 February 2026. https://www.londonstockexchange.com/news-article/HUI/ksa-waste-plastics-to-saf-illustrative-model/17442619
11. Hydrogen Utopia International plc, Exponential SAF/Diesel Deployment Potential in KSA, RNS, 18 January 2026. https://www.londonstockexchange.com/news-article/HUI/exponential-saf-diesel-deployment-potential-in-ksa/17418783
12. Hydrogen Utopia International plc, HUI signs MOU with waste co-ordinator in KSA, RNS, 22 April 2026. https://www.londonstockexchange.com/news-article/HUI/hui-signs-mou-with-waste-co-ordinator-in-ksa/17559691
13. Hydrogen Utopia International plc, Proposed Letter of Intent and Licence Request, RNS, 6 April 2026. https://www.londonstockexchange.com/news-article/HUI/proposed-letter-of-intent-and-licence-request/17534216
14. Hydrogen Utopia International plc, HUI to enter military market with Fortress Fuel, RNS, 5 May 2026, and Update on Fortress Fuel Initiative, RNS, 4 June 2026. https://www.londonstockexchange.com/news-article/HUI/hui-to-enter-military-market-with-fortress-fuel/17575617; https://www.londonstockexchange.com/news-article/HUI/update-on-fortress-fuel-initiative/17622716
15. Utrecht University Hydrogen Initiative, used as the source for the general Utrecht hydrogen-market framing referenced in the hydrogen-market-waves discussion. https://hydrogen.sites.uu.nl/
16. ACER, European hydrogen markets 2025 Monitoring Report, used for the claim that the hydrogen market is moving toward infrastructure, regulation, end-use and cost discipline rather than broad narrative alone. https://www.acer.europa.eu/monitoring/European-hydrogen-markets-2025
17. GOV.UK, Sustainable Aviation Fuel (SAF) Mandate collection, used for UK SAF mandate levels and certificate/buy-out policy context. https://www.gov.uk/government/collections/sustainable-aviation-fuel-saf-mandate
18. GOV.UK, The SAF Mandate: an essential guide, used for SAF drop-in blending with existing engines and UK mandate pathway/eligibility context. https://www.gov.uk/government/publications/about-the-saf-mandate/the-saf-mandate-an-essential-guide
19. ASTM International, ASTM D7566 Standard Specification for Aviation Turbine Fuel Containing Synthesized Hydrocarbons, used for SAF specification / certification context. https://store.astm.org/d7566-26.html
20. IATA, Sustainable Aviation Fuel (SAF), used for SAF drop-in status, infrastructure compatibility, lifecycle-emissions context and SAF cost/supply challenge. https://www.iata.org/en/programs/sustainability/sustainable-aviation-fuel-saf/
21. IATA, Global Feedstock Assessment for SAF Production, September 2025, used for SAF feedstock-availability and scaling context. https://www.iata.org/en/publications/economics/reports/global-feedstock-assessment-for-saf-production/
22. Hydrogen Utopia International plc, Plasma Technology webpage, used for HUI/InEnTec PEM technology description, TRL9/MENA/GCC positioning, syngas/glassy slag, modular design and HUI KSA presentation material. https://www.hydrogenutopia.eu/plasma-technology
23. ASTM / Velocys SAF pathway explainer, used for Fischer-Tropsch SAF pathway and ASTM-approved SAF pathway context. https://velocys.com/astm-approved-saf-pathways/
24. The Chemical Engineer, Air Products quits Tees Valley gasification, 5 April 2016, used as cautionary reference for large integrated waste-to-energy / gasification scale and operational risk. https://www.thechemicalengineer.com/news/air-products-quits-tees-valley-gasification/
25. IATA Jet Fuel Price Monitor, used for recent conventional jet fuel / Jet A-1 benchmark price. https://www.iata.org/en/publications/economics/fuel-monitor/
26. BloombergNEF, “Sustainable Aviation Fuel Price Outlook: Leveling Off,” 16 July 2026, used for Northwest Europe SAF pricing and comparison with jet fuel. https://about.bnef.com/insights/clean-energy/sustainable-aviation-fuel-price-outlook-leveling-off/
27. e-fuels.com, “SAF production cost 2026 · pathway by pathway,” 13 March 2026, used for Fischer-Tropsch SAF production-cost range. https://e-fuels.com/blog/saf-production-cost-2026.html
28. IMARC, Green Hydrogen Pricing Report / Europe price trend commentary, used for Europe green-hydrogen price indication. https://www.imarcgroup.com/green-hydrogen-pricing-report
29. Future Cleantech Architects, Hydrogen Guardrails Report, February 2025, p.10, used for the external synthetic-fuel / e-fuel hydrogen-intensity benchmark of c.0.52kg H₂ per kg finished product. https://fcarchitects.org/wp-content/uploads/2025/02/FCA-Hydrogen-Guardrails-Report-.pdf
30. NASA, Technology Readiness Levels, used for TRL 8 / TRL 9 definitions and distinction between completed/qualified systems and proven operational use. https://www.nasa.gov/directorates/somd/space-communications-navigation-program/technology-readiness-levels/
31. Hydrogen Utopia International plc, HUI signs an MoU with a Saudi deployment Company, RNS, 6 January 2026, used for Hydrogen Systems EPC/O&M role, Saudi execution capability and non-binding MoU status. https://www.londonstockexchange.com/news-article/HUI/hui-signs-an-mou-with-a-saudi-deployment-company/17399699
32. Hydrogen Utopia International plc, HUI signs MOU with waste co-ordinator in KSA, RNS, 23 April 2026, used for RECYCLEE, up to 200,000tpa feedstock, Jubail and non-binding feedstock framework. https://www.londonstockexchange.com/news-article/HUI/hui-signs-mou-with-waste-co-ordinator-in-ksa/17559691
33. Model-derived calculation using the RNS operating assumptions, Appendix C project DCF, Appendix D fee/carry methodology and the document’s stated share-count assumptions; not a separate external source.
34. FinanceCharts, Franco-Nevada / Wheaton Precious Metals comparison and market-data page, used as illustrative royalty / streaming reference for protected carry / royalty-style valuation lenses. https://www.financecharts.com/compare/FNV,WPM
35. Neste, Annual Report 2025 / Financial Statements Release 2025, used as mature renewable fuels / SAF producer reference and for revenue, EBITDA and renewable-products scale context. https://www.neste.com/investors/financials/annual-report
36. LanzaJet, announcement of $47m new capital and first close of equity round at $650m pre-money enterprise valuation, used as SAF technology / producer reference for ATJ technology, project deployment and private-market valuation context. https://www.lanzajet.com/news-insights/lanzajet-announces-47m-in-new-capital-and-first-close-of-equity-round-at-650m-pre-money-valuation
37. Gevo, Investor Relations and FY2025 results, used as renewable fuels / SAF development-company reference for ATJ platform, carbon-linked revenue and project-development valuation context. https://investors.gevo.com/
38. Velocys, 2023 Annual Report and 2024 take-private / growth-capital announcement, used as FT-SAF / waste-to-synthetic-fuels technology and project-development reference. https://www.annualreports.com/Company/velocys-plc; https://velocys.com/velocys-secures-us40mm-of-growth-capital-and-begins-new-chapter-as-a-private-sustainable-aviation-fuel-technology-company/
39. Hydrogen Utopia International plc, HUI secures UK Licence for SAF, RNS, 17 August 2026, used for UK InEnTec licence, US$500,000 consideration, UK rights and UK SAF platform framing. https://www.investegate.co.uk/announcement/rns/hydrogen-utopia-international--hui/hui-secures-uk-licence-for-saf-/9723813
40. Department for Transport, £219 million to power Britain’s green aviation revolution, GOV.UK, 16 June 2026, used for LCFF funding, £93m near-term support, Advanced Fuels Fund context, UK SAF policy support, jobs and economic contribution estimates. https://www.gov.uk/government/news/219-million-to-power-britains-green-aviation-revolution
41. Department for Transport, Sustainable Aviation Fuel (SAF) Mandate collection and Sustainable Aviation Fuel Revenue Certainty Mechanism materials, GOV.UK, used for mandate levels, tradeable certificates, certificate cash value, GHG-linked certificate award logic and RCM / strike-price revenue-certainty framework. https://www.gov.uk/government/collections/sustainable-aviation-fuel-saf-mandate ; https://www.gov.uk/government/speeches/sustainable-aviation-fuel-revenue-certainty-mechanism ;
42. RFTO The UK's Renewable Transport Fuel Obligation (RTFO) previously covered aviation fuels, but general RTFO explanations and statistics published before 2025 have been superseded by the dedicated Sustainable Aviation Fuel (SAF) Mandate17/18. Aviation is now regulated separately to ensure the sector directly bears decarbonisation costs.
https://www.gov.uk/government/collections/renewable-transport-fuel-obligation-rtfo-scheme
43. National Wealth Fund
https://www.instituteforgovernment.org.uk/explainer/national-wealth-fund
44. O Power-to-X / SAF / hydrogen / e-fuels experience
https://ioconsulting.com/power-to-x-pathways-to-decarbonisation. It discusses IO’s Power-to-X framework, including hydrogen, ammonia, methanol, hard-to-abate sectors, carbon dioxide use, certification, premium pricing and techno-economic assessment.
45. IO sector capability: SAF, green hydrogen, e-fuels
https://ioconsulting.com/sector/energy-chemicals It states that IO supports Power-to-X solutions including Sustainable Aviation Fuel, Green Hydrogen, Green Ammonia, e-Methanol and e-fuels, and provides FEL / advisory support across energy, chemicals and resources.
46. IO PreFEED / FEED / owner-side project-definition capability
https://ioconsulting.com/capabilities It says IO works across the project-development lifecycle and provides independent technology validation, bankable feasibility studies, PreFEED, FEED, basic engineering, owner’s engineer and due diligence, including projects in hydrogen, SAF and CCUS
47. Project Starling / owner-side credibility
https://ioconsulting.com/case-studies/project-starling-asap-dac-prefeed It describes IO’s work with Carbon Neutral Fuels and Mission Zero on Project Starling, including PreFEED / FEL2, system integration, FT synthesis, upgrading, cost modelling, policy-driven certificate revenues, HAZID / ENVID and positioning the project for FEED.
48. IO consulting appointment RNS
Master Services Agreement with io consulting
Use https://www.investegate.co.uk/announcement/rns/hydrogen-utopia-international--hui/master-services-agreement-with-io-consulting/9730766 from Investegate or
https://ioconsulting.com/hui-partners-with-io-to-advance-uk-saf-development own site, which adds detail on the capital value process, feasibility through project definition, UK SAF support, funding/financing routes, and stakeholder engagement. [ioconsulting.com]
49 — UK SAF Mandate buy-out / certificate mechanism
GOV.UK SAF mandate government response/source confirming the tradeable certificate scheme, HEFA cap, GHG-linked certificates, and buy-out prices of £4.70/litre for the main obligation and £5.00/litre for the PtL obligation: https://www.gov.uk/government/consultations/pathway-to-net-zero-aviation-developing-the-uk-sustainable-aviation-fuel-mandate .
We will reach out for a quick introductory fact find to see how we can best serve your specific needs and arrange a convenient time for a consultation with a member of the appropriate specialist team.
An Advisory Broker will contact you for a deeper fact find and share information on how we can best enhance your portfolio.
We will process your application in accordance with FCA regulations to ensure that your appropriate risk profile is set. You will then have access to an extensive suite of investments, supported by your dedicated Advisory Broker.
